Forecasting Bitcoin Price with Network Theory
An interesting method I observed for predicting, specifically, Bitcoin price using networks, was in the study Forecasting Bitcoin Price with Graph Chainlets; which I highly recommend checking out (the cakcora website listed at the bottom). In the study they use a heterogeneous graph model to portray a “Bitcoin graph” composed of addresses, transactions and blocks. Figure 1, taken from the study, shows an example network for 4 transactions and 13 addresses.

Because cryptocurrency information of distribution is, by design, open to the public, anyone is able to observe all financial interactions on the network and analyze how the network evolves over time per user. The data they used comes from years 2009 to 2018, in which they parsed the Bitcoin blockchain files, and extracted blocks, transactions and addresses. Rather than observing graphs with multiple transactions or individual edges and nodes, they chose to analyze what they called “chainlets” which represent subgraphs within the main graph. This means taking one block, representing a transaction in time, with its inputs and outputs and comparing this subgraph to others.
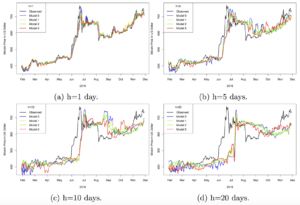
Ultimately, they observed different kinds and groupings of chainlets into 5 different models and paired the models to the data of how they performed from 2009 to 2018 (shown in figure 6 bellow).
All in all, nascent (new) markets like cryptocurrency are inevitably unstable for many reasons. The main reason being, there is limited liquidity in the market, compared to a more established market like traditional economies. For example, the total value of all the money in the world is more than $90 trillion, whereas the total cryptocurrency market value is around $250 billion (a 36,000% difference). This leads to a very thin market to work with that moves quickly up and down, increasing the volatility of cryptocurrency prices. This sounds like an amazing platform to analyze and take use of in theory; though, if cryptocurrency wasn’t such a fluctuating market, it could produce more consistent results overtime. This is why graph theorists try to analyze the “extreme” cases or volatility in crashes of cryptocurrency. As of now graph theorists can make predictions for where the market will go, but with such a new developing market the risk will be inevitably high regardless of what the theorist claims.
https://cakcora.github.io/blockchain/Forecasting%20Bitcoin%20Price%20with%20Graph%20Chainlets.pdf