Lecture 17: Hypothesis tests#
Recap#
Statistical significance#
Statistically significant means that the results are unlikely to have occurred by random chance alone.
The set of observational units on which data is collected is called the sample. A statistic is a number summarizing the data in the sample.
For a random process, a parameter is a long-run numerical property of the process.
Example: \(\pi\) is the long run probability that Sarah the Chimpanzee selects the correct photo (not 3.14…).
Hypotheses and p-values#
A p-value is the probability of finding a result at least as extreme/surprising, if outcomes happened by random chance alone.
The null hypothesis corresponds to “just chance” or “no effect.”
The alternative hypothesis corresponds to “better than chance” or “an effect.”
Small p-value → evidence against the null hypothesis.
“Small” means less than 0.05.
p-value visualization#
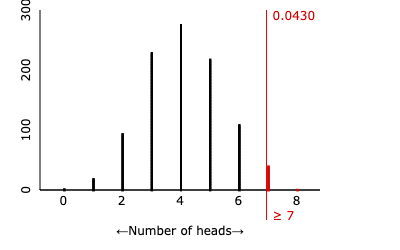
The p-value is represented by the red area in the dotplot.
What a p-value is not#
A p-value is the probability of finding a result at least as extreme/surprising, if outcomes happened by random chance alone.
Can be thought of as
\[\mathrm{Pr}[\text{result } | \text{ null hypothesis is true}]\]which is not the same as
\[\mathrm{Pr}[\text{null hypothesis is true } | \text{ result}]\]
Computing p-values#
To compute a p-value, we need a model for what the results would have looked like if there was no effect.
Three questions:
If the null was true, what would be the “probability of success”?
What should be the “number of trials” (also called the sample size)?
What value will you compare the simulated data to?
Did Dream cheat?#
Dream#
Dream is a Minecraft speedrunner.
A speedrunner tries to beat a video game as quickly as possible.
In October 2020, Dream was accused of cheating during a Minecraft speedrun.

The evidence for cheating#
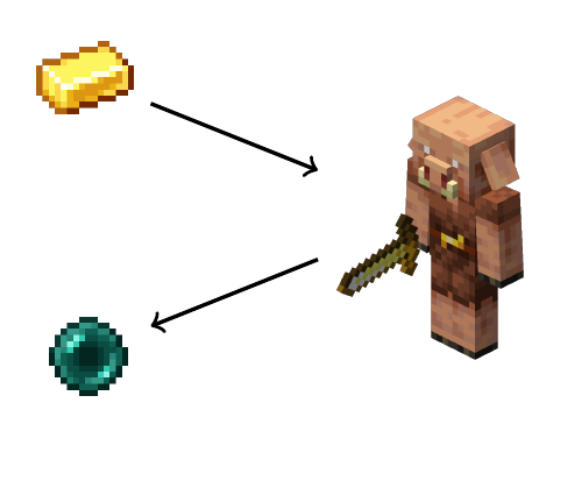
To beat Minecraft, you have to trade gold ingots with a piglin for ender pearls.
Each time you trade, there is a \(\frac{20}{423} \approx .0473\) probability that the piglin will give you an ender pearl.
In 262 trades, Dream got ender pearls 42 times.
Hypotheses#
What are the null and alternative hypotheses for Dream’s results?
The null hypothesis is that Dream just got lucky.
The alternative hypothesis is that Dream was cheating had a higher probability of receiving ender pearls.
If \(\pi\) is the parameter representing the probability Dream receives an Ender pearl, then the null hypothesis is \(H_0 : \pi = \frac{20}{423}\) and the alternative hypothesis is \(H_A : \pi > \frac{20}{423}\).
Computing the p-value#
a. If the null was true, what would be the “probability of success”?
b. What should be the “number of trials”?
c. What value will we compare the simulated data to?
a. \(\frac{20}{423}\) (the probability of getting an under pearl if the null is true).
b. 262 (the number of times Dream traded).
c. 42 (the number of times he received an Ender pearl).
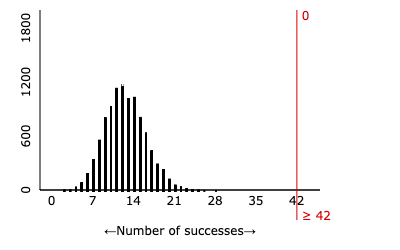
Computing the p-value#
Let’s use the One Proportion applet.
The p-value is essentially 0. There is very strong evidence that Dream was cheating.
Aftermath#
In May 2021, Dream admitted that he had cheated but claimed it was an accident.
For more information about this scandal, watch this video.
More minecraft#
Suppose you did your own speedrun attempt.
In 400 piglin trades, you only got 15 ender pearls.
Is the game unfair against you?
Hypothesis#
What are the null and alternative hypotheses for your results?
The null hypothesis is that the game is fair and the probability of receiving an ender pearl is \(\frac{20}{423}\).
The alternative hypothesis is that the game is unfair and the probability of receiving an ender pearl is less than \(\frac{20}{423}\).
In symbols: \(H_0: \pi=\frac{20}{423}\) and \(H_A : \pi < \frac{20}{423}\) where \(\pi\) is the probability of receiving an ender pearl.
Computing the p-value#
a. If the null was true, what would be the “probability of success”?
b. What should be the “number of trials”?
c. What value will we compare the simulated data to?
a. \(\frac{20}{423}\) (the probability of getting an ender pearl if the game is fair).
b. 400 (the number of times you traded).
c. 15 (the number of times you received an Ender pearl).
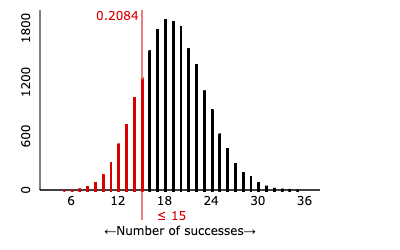
Computing the p-value#
In the One Proportion applet we have to change \(\ge\) to \(\le\) under Count Samples.
The p-value is around 0.21, we do not have evidence that the game is unfair.
Test directions#
Different alternative hypotheses#
For Dream’s results, the hypotheses were:
\(H_0 : \pi = \frac{20}{423}\)
\(H_A : \pi > \frac{20}{423}\)
For your results, the hypotheses were:
\(H_0 : \pi = \frac{20}{423}\)
\(H_A : \pi < \frac{20}{423}\)
The alternative hypotheses point in different directions!
Different comparisons#
The direction of the hypothesis changes what is “extreme”.
For Dream, “more extreme” meant “42 or bigger”
For you, “more extreme” meant “15 or smaller”
Determining the direction#
Ask yourself: “If the results weren’t caused by random chance, what would the results look like?”
Dream: the alternative hypothesis is that Dream is cheating. We would expect him to get more Ender pearls than just by chance.
You: the alternative hypothesis is that the game is unfair against you. We would expect you to get fewer Ender pearls than just by chance.
These are both examples of directional or one-sided hypotheses.
Non-directional hypotheses#
Sometimes, the alternative hypothesis does not have a clear direction.
MythBusters wanted to see if toast was more likely to land “butter side up” or “butter side down.”
They built a toast dropping rig and dropped 48 pieces of buttered toast.
Toast experiment#
What is the null hypothesis?
Let \(\pi\) be the probability the toast lands butter side down. The null is \(H_0 : \pi = 0.5\).
What are some reasons why the null hypothesis could be false?
The butter side is heavier and more likely to land butter side down \(H_A : \pi > 0.5\).
Putting the butter on the toast makes it curved and more likely to land butter side up \(H_A : \pi < 0.5\).
We can combine both of these reasons into a non-directional hypothesis: \(H_A : \pi \neq 0.5\)
Computing the p-value#
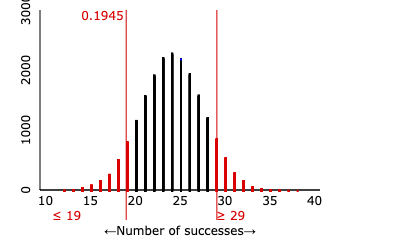
The MythBusters dropped 48 pieces of toast and 19 landed butter side down.
To compute the p-value: a. If the null was true, what would be the “probability of success”? b. What should be the “number of trials”? c. What value will we compare the simulated data to?
The probability of success is 0.5, the number of trails is 48 and the number to compare to is 19.
Computing the p-value#
Since we have a non-directional hypothesis, “more extreme” means “more successes than expected” and “fewer successes than expected”.
When we compute the p-value we need to count simulations in both tails.
In the One Proportion applet we can select “two-sided”
p-value results#
The p-value is around 0.19.
We do not have evidence against the null hypothesis that toast is equally likely to land butter side up or butter side down.
One-sided hypothesis summary#
Sometimes the alternative hypothesis has a direction:
The number of successes is expected to be bigger (\(>\)) than what would happen by chance.
The number of successes is expected to be smaller (\(<\)) than what would happen by chance.
These called are directional or one-sided hypotheses.
Two-sided hypothesis summary#
Sometimes the alternative hypothesis does not have direction:
The number of success is expected to be different (\(\neq\)) than what would happen by chance.
These are non-directional or two-sided hypotheses.
The type of alternative hypothesis (\(>\), \(<\), \(\neq\)) determines what is “more extreme” in the p-value calculation.
Two-sided as a default#
If you are not sure whether to do a one-sided or two-sided test, a two-sided test is a good default.
You don’t want to miss an interesting result just because the direction was different from what you were expecting.
The glue in Post-It Notes was discovered by accident. A scientist at 3M was trying to create a strong glue but accidentally made a weak one!
Type 1 and type 2 errors#
Types of errors#
In hypothesis testing there are two potential errors that could be made:
The null hypothesis is true, and we reject the null hypothesis.
The alternative hypothesis is true, and we do not reject the null hypothesis.
The first type of error is called a type 1 error and the second is called a type 2 error.
Types of errors visualized#
Truth |
|||
|---|---|---|---|
\(H_0\) |
\(H_A\) |
||
Decision |
reject \(H_0\) |
Type I error |
|
don’t reject \(H_0\) |
Type II error |
Type 1 error: the null hypothesis is true, and we reject the null hypothesis. This is a “false alarm” or false positive.
Type 2 error: the null hypothesis is false, and we do not reject the null hypothesis. This is a “missed opportunity” or a false negative.
Types of errors for dream#
In the Dream cheating example:
a. How would you describe a type 1 error in English?
b. How would you describe a type 2 error in English?
a. A type 1 error would be accusing Dream of cheating when he is actually innocent.
b. A type 2 error would be letting Dream get away with cheating.
Questions about errors#
Can we know for sure if we have made a type 1 or type 2 error? Why or why not?
We cannot be certain that we haven’t made a type 1 or type 2 error because we can’t definitively know whether the null or alternative hypothesis is true.
How could we make sure that we never make a type 1 error? Would this be a good idea?
The only way to make sure we never make a type 1 error would be to never reject the null hypothesis. If we did this, we would make lots of type 2 errors.
Error rates#
Since we cannot determine whether we have made an error, statisticians instead work with error rates.
The Type 1 error rate is:
\[\frac{\text{Number of times a type 1 error is made}}{\text{Number of times the null hypothesis is true}}\]The Type 2 error rate is:
\[\frac{\text{Number of times a type 2 error is made}}{\text{Number of times the alternative hypothesis is true}}\]
p-values and type 1 error rate#
Our rule: if the p-value is small (less than 0.05), then we reject the null hypothesis.
These rule makes the type 1 error rate at most 0.05.
If we made the threshold smaller (0.01 instead of 0.05), then what would happen to the type 1 and type 2 error rates?
The type 1 error rate would go down but the type 2 error rate would go up.
Type 2 error rate and power#
The type 2 error rate is a bit more complicated.
The type 2 error rate depends on:
The alternative value of \(\pi\).
The sample size.
For a specific alternative \(\pi\) and sample size \(n\), the power is the probability of (correctly) rejecting the null.
\[\text{Power} = 1 - \text{Type 2 error rate} \]
Example#
On Monday, we saw an experiment where Sarah the chimpanzee solved 7 out of 8 problems.
We can use an applet to study the power under different scenarios.
When researchers prepare to do a study, they often do a power analysis to determine the sample size.
For example: for a given alternative (maybe \(\pi=0.75\)), how big does the sample size need to be so that the power is at least 80% or 90%?
Type 1 and 2 errors summary#
Truth |
|||
|---|---|---|---|
\(H_0\) |
\(H_A\) |
||
Decision |
reject \(H_0\) |
Type I error |
|
don’t reject \(H_0\) |
Type II error |
The type 1 error rate is the probability of incorrectly rejecting the null hypothesis. The type 1 error rate is equal to the p-value threshold (often 0.05).
The type 2 error rate is the probability of incorrectly not rejecting the null hypothesis. The type 2 error rate depends on the specific alternative and the sample size.
Hypothesis testing summary#
For this week’s quiz, you need to be able to:
Describe null and alternative hypotheses in English and in terms of a parameter.
Explain how you would use a simulation to compute a p-value.
Interpret a given p-value in terms of the null hypothesis.
Other important topics:
One-sided vs two-sided hypotheses.
Type 1 and type 2 error rates.