MATLAB Motivation
While the SPICE simulation is good for verifying the circuit topology and component selection, it isn't suited for long simulations. This makes it difficult to test the actual desired output for this module, as the desired output wave has a period of 16.7ms, which would take eons to simulate in the resolution that SPICE does. In addition to the difficulties of running such a long simulation, the problem of implementing a robust PD controller as well as higher level control logic becomes a serious issue, as SPICE is ill equipped to do so.
MATLAB Methodology
In order to be able to quickly simulate the entire system and at a scale that could capture startup conditions as well as the desired output signal, the MATLAB simulation was designed to only simulate the cycle to cycle variations in the current and voltages flowing through elements in the module. Using the equations for calculating the change in current through the buck/boost inductor over a cycle, it is possible to use the forward Euler method to track the current through the three branches per cycle. Then, using the flow of currents and energy conservation laws, it is possible to track the voltages of the input and outputs, assuming ideal diodes, capacitors, inductors, and switches. The battery is also assumed to be ideal, in that it can sink any amount of current from the charging node without changing voltage, and it can produce any amount of current for the flyback converter on the output. While this is a tough assumption to make for a single battery, for a large bank of batteries in parallel, which the current in or out would be distributed over, it is a reasonable assumption.
The MATLAB is broken up into three different files:
The first step was verifying that the module simulation itself worked, which was proved by leaving out all control logic, setting initial conditions, and fixed duty cycles and seeing if the outputs settled to the expected values. After many bugs, the results finally managed to meet the expectations, and as is visible below, there is significant ringing in the output, which takes around 25ms to settle, much too slow to be generating a 60Hz rectified sine wave (note that the 60Hz sine wave when rectifies looks like a 120Hz signal).
The MATLAB is broken up into three different files:
- Top level module which contains all the code to simulate the power elements in the circuit and sets initial conditions
- State controller, which determines which state the module is in, whether it should be charging or discharging the battery due to a surplus or deficit of power coming from the photo-voltaic, as well as determining the setpoint for the buck-boost/flyback controllers.
- Buck-boost/flyback controller which takes a setpoint, current conditions, and produces a duty factor to reach the target with minimal oscillation.
The first step was verifying that the module simulation itself worked, which was proved by leaving out all control logic, setting initial conditions, and fixed duty cycles and seeing if the outputs settled to the expected values. After many bugs, the results finally managed to meet the expectations, and as is visible below, there is significant ringing in the output, which takes around 25ms to settle, much too slow to be generating a 60Hz rectified sine wave (note that the 60Hz sine wave when rectifies looks like a 120Hz signal).
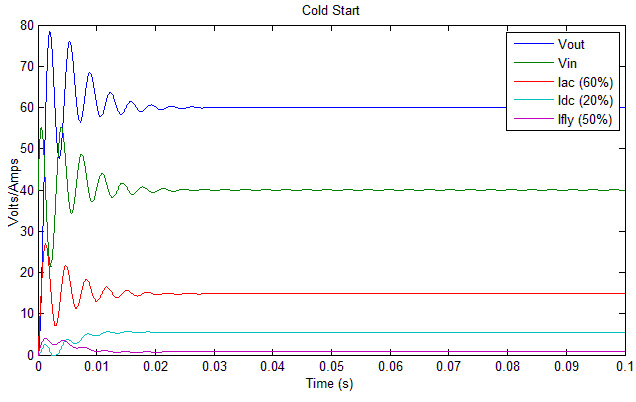
Cold start with no controller and fixed duty cycles
Controls were then introduced, and the difference is apparent. The output settled much faster (within 15ms), and the oscillation at the input is removed.
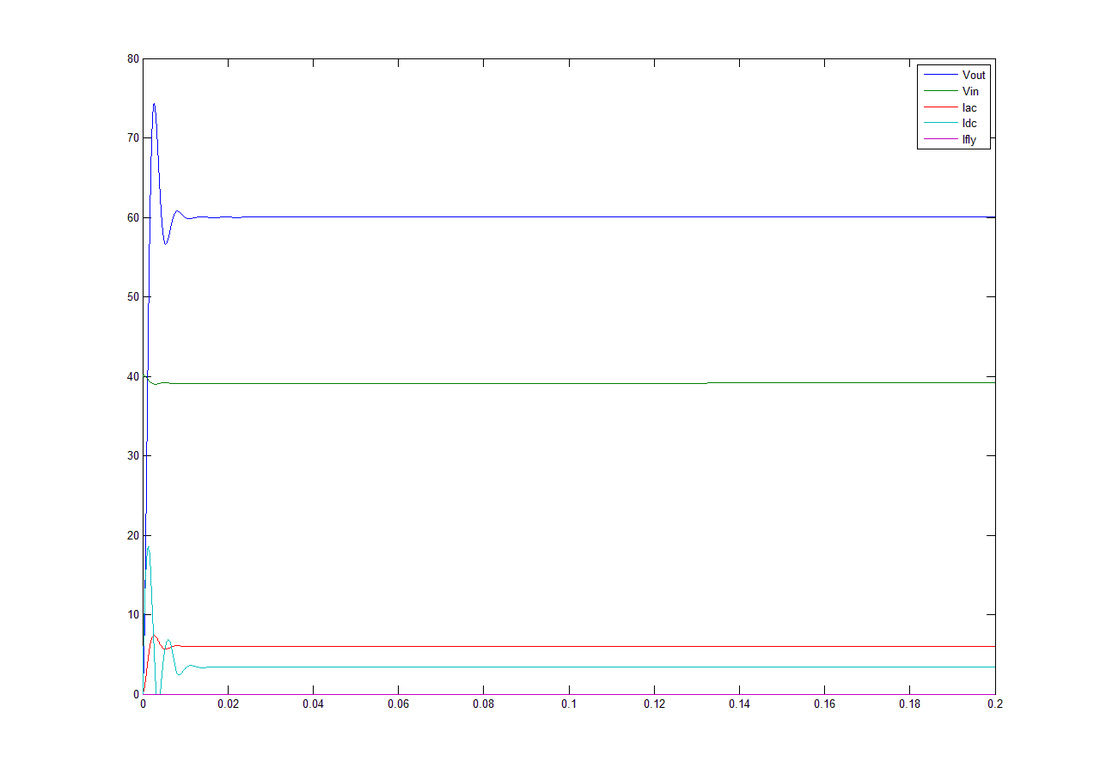
Cold start with controller, 10A input, surplus power
Once it is confirmed that a fixed DC output is attainable, the output target is set to a 60Hz rectified sine wave. Below you can see that the output is in fact a 60Hz rectified sine wave (although there is some trouble achieving a null point at the bottom), and that in the less power demanding moments of the output, the current flowing into the battery (in cyan) increases so that power isn't wasted. Since there is an excess of power, the flyback converter from the output of the battery remains off.
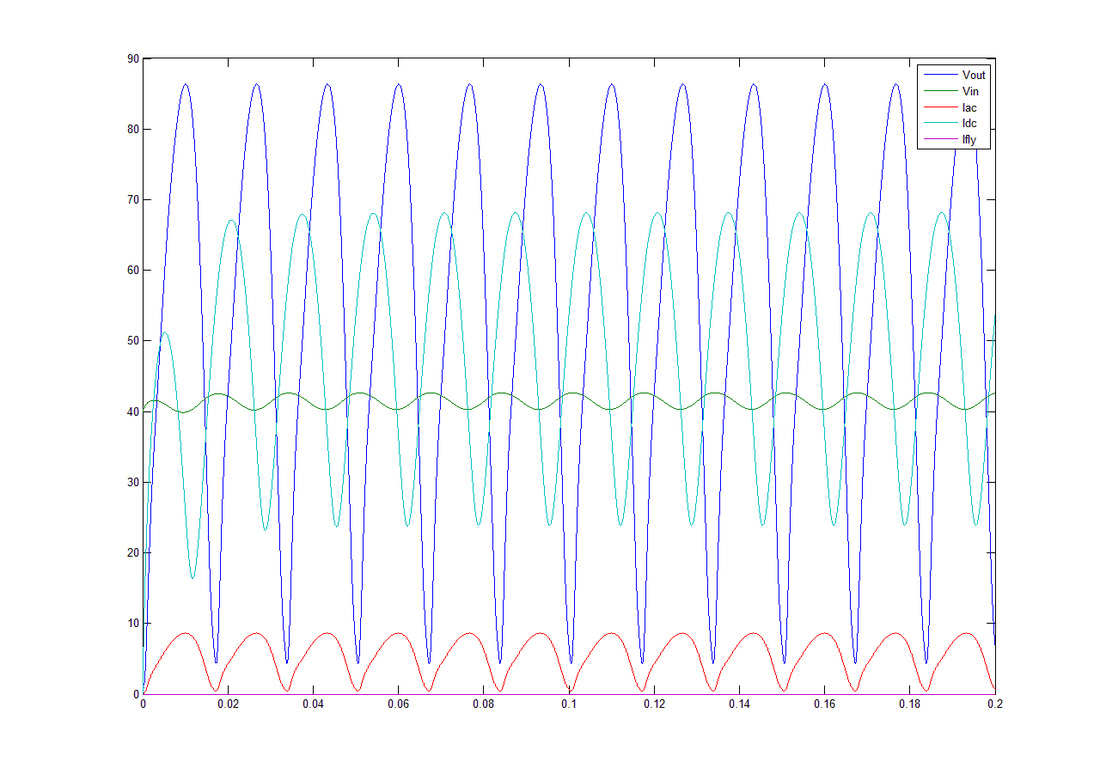
Cold Start, 60Hz rectified output, 20A input, surplus
The below graph is from the same simulation as the one above, but it shows the different duty cycles for the three branches, AC (power from the PV straight to the AC load), DC (power from the PV into the battery), and FLY (power from the battery to supplement the AC branch when there is a power deficit). You can see the correlation from the duty cycles to the current flows in the previous graph.
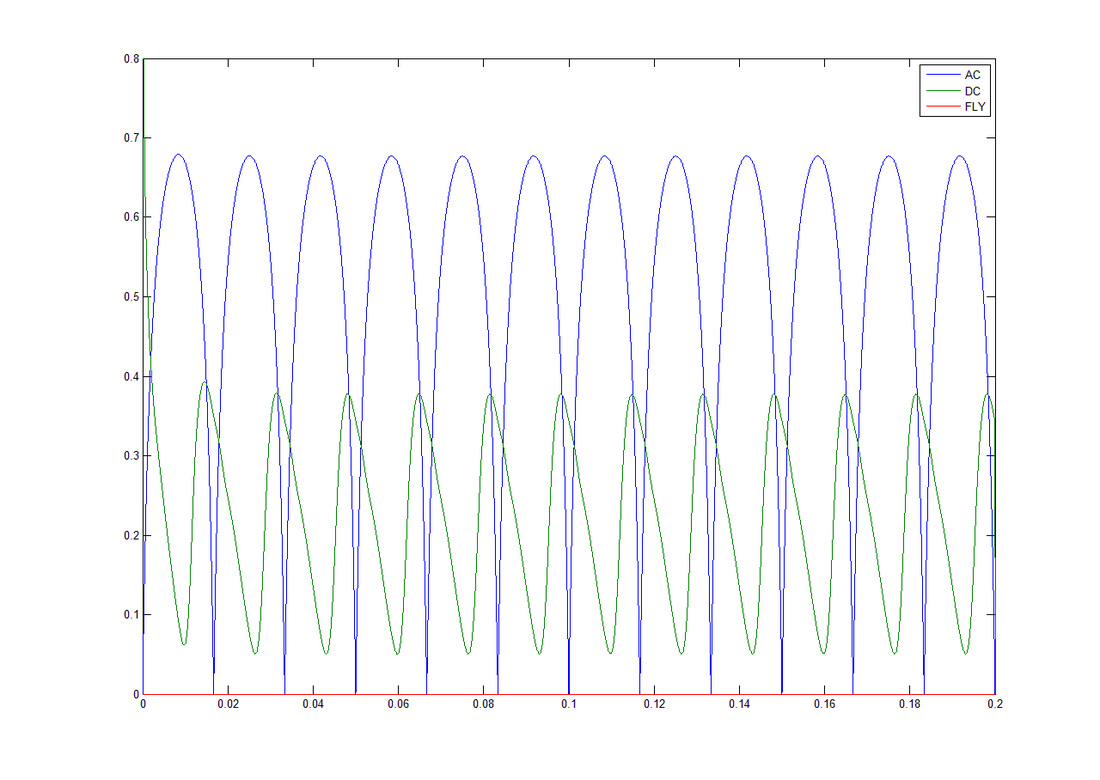
Duty cycles for 60Hz rectified output, 20A input, surplus
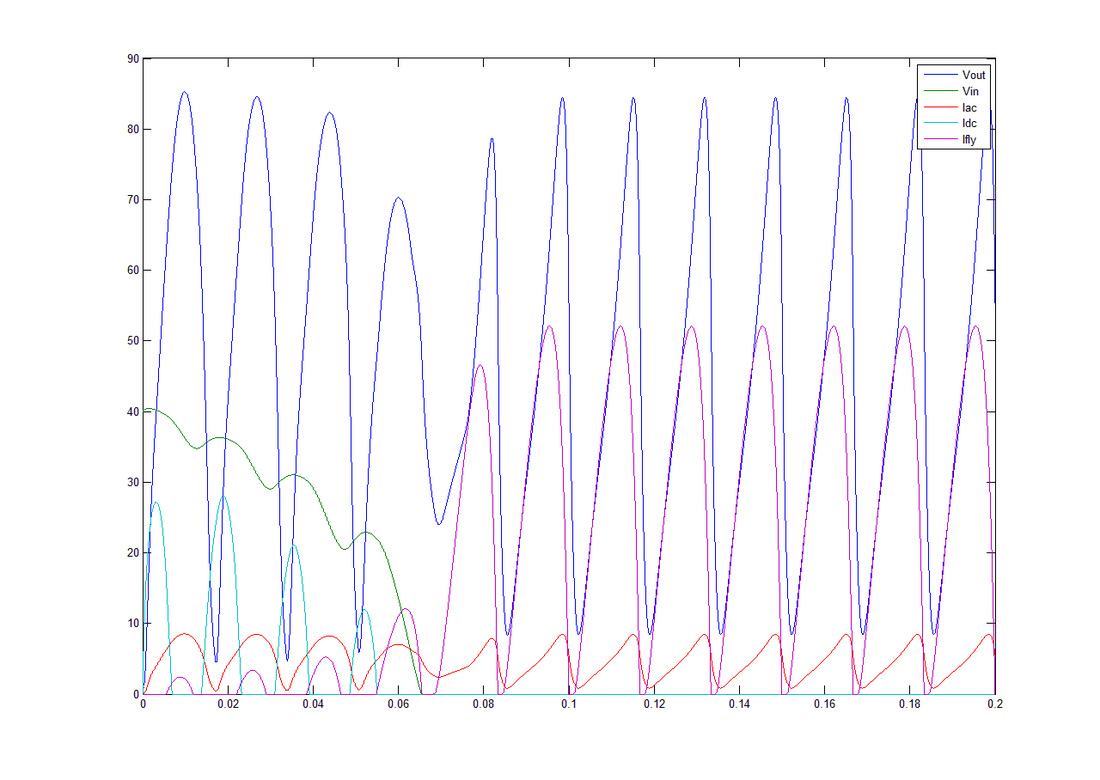
The following graph shows a situation when the PV isn't producing enough power to run the output. The DC branch slows down the battery charging until it turns completely off and the flyback converter kicks in, here at about .06s, causing a momentary interruption of the AC output until the battery is able to run the output on its own.
AC/DC branch handoff to FLY branch. 10A input, deficit