|
|
Reaction Time to Spatial Frequency Measured with the Point Process MethodRobert F. Dougherty Based on a poster presented at ARVO in May 1998. |
|
Background
In real world situations where response time to sudden events is important, unexpected events (by definition!) do not happen in discrete trials preceded by warning tones. For example, while driving a car down a residential street, something may suddenly cross your path. The object must be identified and appropriate action taken. If it is a tumbleweed, the appropriate action may be to proceed, allowing your vehicle to run it over. However, if the obstacle appears to be a child, you will want to slam on the brakes as quickly as possible. Occasionally, such as during a windstorm, you may encounter many obstacles, most of which may be run over. However, you must remain vigilant, for one of those obstacles may turn out to be a child.
To push this example, assume that the tumbleweeds are randomly dispersed. Then, the time between one tumbleweed crossing your path and the next will be an exponentially distributed random deviate having some mean (proportional to the density of tumbleweeds). Such exponentially distributed random periodic events are known as Poisson point processes. The nature of Poisson processes are such that the occurrence of one event (a tumbleweed blows across your path) is completely unpredictive about when the next event (or tumbleweed) will occur.
The unpredictable nature of the time of the next event in a Poisson processes is in stark contrast to many reaction time studies. Such studies are generally divided into discrete trials which typically feature a warning event, a random delay drawn from a rectangular distribution, followed by the target event. The discrete trial with its warning event is something that is rarely encountered in the real world. Also, non-exponentially distributed random delays are not entirely unpredictable.
A more ecologically valid method for assessing reaction time to sudden, brief events has been proposed by Bill Simpson (refs 1 & 2). This method involves runs of several minutes during which the observer must respond as rapidly as possible to the target events. These events come without warning and with exponentially distributed random delays between them. The present study validates this "point process method" by exploring a well known relation between spatial frequency and reaction time.
Purpose
- To further develop an RT paradigm based on point-processes (refs 1 & 2)
- To measure reaction time to stimuli of various spatial frequencies
- Point Process Method Advantages:
- A more realistic RT task- real world events don't come in discrete trials with warning tones!
- More efficient
- Provides more information (e.g., can extract non-linearities when stimuli closely follow one another)
System Identification: Noise
- The white noise response is one method used to characterize a linear system
- A white noise stimulus is presented to a system and its response is measured
- The stimulus may be cross-correlated with the response to produce an estimate of the system's impulse response

Point Process RT Method
- Present stimuli as a Poisson process (a point-process version of noise)
- Continuously flash stimuli with exponentially distributed random delays between flashes
- Subject responds whenever a stimulus is seen (responses form a second point process)
- Point process data are made into a time series of 0s and 1s for analysis
- Cross correlate stimulus & response to determine system transfer function (ref 3)

Details
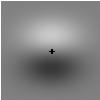
- Stimuli were foveal, 1.5 deg extent Gabors on a 32 deg x 23 deg, 10 cd/m^2 gray field
- Brief duration- one 75Hz screen refresh (i.e., 13 ms)
- Spatial frequencies: 0.5, 1, 2, 4, 8 & 16 cycles/deg
- Apple 17" Multiscan display, Power Mac 8500 (contrast resolution enhanced with bit-stealing (ref 4), Gravis gamepad response device
- Gabors were presented during 1-3 minute runs with exponential-random delays between presentations (3 second mean delay)
Contrast Equalization
- Detection thresholds measured with 2IFC staircase
- Contrast set to 2.5 times threshold
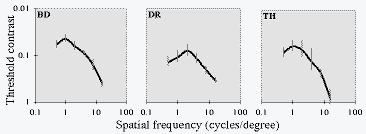
Contrast Sensitivity functions for the 3 observers.
Error bars = 95% CI; from bootstrap (ref 5) variance of psychometric function fit
Data Analysis
- Stimulus and response point processes converted into a discrete time series
of 0's (no event) and 1's (event)

- The temporal bin size used for the conversion to a time series determines the
temporal resolution
- smaller bins provide better resolution, but require more data to produce smooth functions
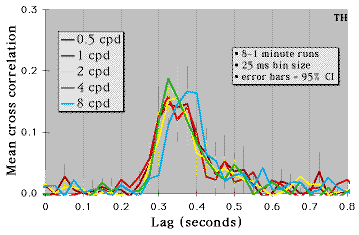
- The cross correlation of these time series estimates the impulse response of eye-brain-hand system
One Observer's Cross Correlations
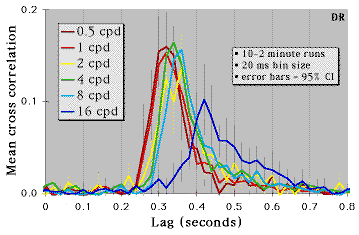
A Second Observer's Cross Correlations
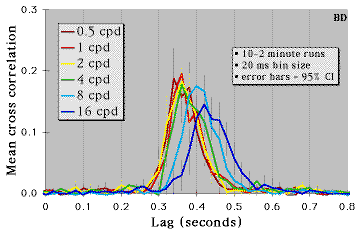
A Third Observer's Cross Correlations
Results Summary
- RT estimate = peak of cross intensity function
- Data for 3 observers (BD, DR & TH) compared to traditional RT method (ref 6: MWG & BB, at 5.5 times detect threshold; from their fig. 1)

Conclusions
- RT to high spatial frequencies is slower than RT to low SFs
- ~20 ms increase per SF octave
- The RT-to-SF slope replicates previous findings
- Overall, our RT estimates may be slower- perhaps due to predictiveness of non-exponential random delay used in most RT studies (see ref 2)
- Point process RT method works!
Other Uses for Noise
- Point process method for auditory & somatosensory RT
- Simultaneous visual, auditory and somatosensory RT (can reveal cross modal facilitation and inhibition)
- Multifocal ERG & VEP (e.g., ref 7)
- Visual field mapping with fMRI (can provide cortical retinotopy and an estimate of the hemodynamic response)
- Point process visual search task- no discrete trials makes for a more ecologically valid task
References
- Simpson, W.A. (1997). personal communication.
- Simpson, W.A., Braun, W.J., Bargen, C. & Newman, A.J. (1998). A new approach to simple visual reaction time using point processes. Investigative Ophthalmology & Visual Science, 39: S405.
- Brillinger, D.R. (1994). Time series, point processes, and hybrids. Canadian Journal of Statistics, 22: 177-206.
- Tyler, C.W., Chan, H., Liu, L., McBride, B., Kontsevich, L.L. (1992). Bit stealing: how to get 1786 or more gray levels from an 8-bit color monitor. SPIE proceedings, 1666: 351-364.
- Foster, D.H. & Bischof, W.F. (1991). Thresholds from psychometric functions: Superiority of bootstrap to incremental and probit variance estimators. Psychological Bulletin, 109: 152-159.
- Greenlee, M.W. & Breitmeyer, B.G. (1989). A choice reaction time analysis of spatial frequency discrimination. Vision Research, 29: 1575-86.
- Baseler, H.A. & Sutter, E.E. (1997). M and P components of the VEP and their visual field distribution. Vision Research, 37: 675-690.
