|
Comparison of Visual Activation Measured by fMRI and High Resolution EEG
R.F. Dougherty, S.M.W. Au Young, D.E. Giaschi, B.H. Bjornson,
P.K.H. Wong
British Columbia's
Children's Hospital and University of
British Columbia, Vancouver, Canada
Poster presented at Human Brain Mapping 1998; Published in NeuroImage.
EEG and fMRI are complementary techniques: fMRI provides better spatial resolution and EEG provides better temporal resolution. High resolution EEG (HR-EEG) with deblurring coregisters EEG signals with anatomic MR images. It also corrects distortion of signals passing through the skull. To assess the spatial advantages of deblurring, we compared HR-EEG data with fMRI data, using a visual hemifield stimulation paradigm.
Methods
Five normal adults (2 female, 3 male) underwent both fMRI and HR-EEG. Visual stimulation for both techniques consisted of 5 minutes of 30-second alternations between left and right hemifield stimulation. The stimulus was a black and white half-dartboard contrast-reversing at 8 Hz. Functional MRI and HR-EEG data were coregistered with the same anatomic MRI dataset for each subject.
fMRI: The anatomic and functional MRI data were acquired transaxially with a GE Signa 1.5T scanner. Anatomic scans were T1-weighted (1 x 1 x 1.5 mm voxels). The 5-minute functional time series measured gradient echo BOLD contrast (TR = 2.5 s, TE = 50 ms, flip angle = 90deg., 3.75 x 3.75 x 4 mm voxels). SPM96 was used to correct for motion artifact and to contrast left and right hemifield stimulation epochs to produce activation maps.
High Resolution EEG with finite element deblurring (1): EEGs were recorded with 84 scalp electrodes while subjects viewed the contrast-reversing half-dartboard. The scalp potentials for hemifield stimulation were estimated by extracting the EEG frequency component corresponding to the reversal rate of the stimulus. Finite element deblurring utilizes anatomic MRI data to produce an individualized 3D reconstructed head model upon which scalp potentials are mapped. The scalp and skull thickness from the anatomic MRI and scalp potentials from the EEG were then used to compute spatially enhanced cortical surface activation maps.
Results and Conclusions
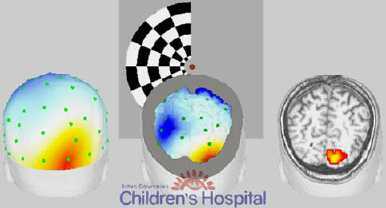
HR-EEG activation maps for one subject, before and after deblurring, are presented below and compared with the same subject's fMRI response (left to right). HR-EEG and fMRI both show the expected contralateral pattern of occipital lobe activation. Deblurring enhances the spatial resolution of visual evoked potential maps, and compares favorably with fMRI data.
1. Gevins, A., Le, J., Martin, N.K., Brickett, P., Desmond, J., and Reutter, B. (1994) Electroencephalography and Clinical Neurophysiology, 90(5):337-358. (back)
Data processing:
- EEG data analyzed and imaged with Manscan® (SAM Technologies, San Francisco, CA).
- Functional MRI data analyzed with SPM96 (Wellcome Department of Cognitive Neurology, University College, London) and imaged with AFNI, both running on a Silicon Graphics O2.
- Thanks to Kent Kiehl for help with collection and analysis of some of the fMRI data.