Introduction to Graphs
CS 106B: Programming Abstractions
Autumn 2020, Stanford University Computer Science Department
Lecturers: Chris Gregg and Julie Zelenski

Slide 2
Announcements
- Assignment 7 is due on Wednesday at 11:59pm
- The last section is this week!
- Make sure you start working on your project write-up, which will be due on Sunday, November 15th, 11:59pm. This hard deadline with no grace period.
- Next week you will present your projects to your SL.
Slide 3
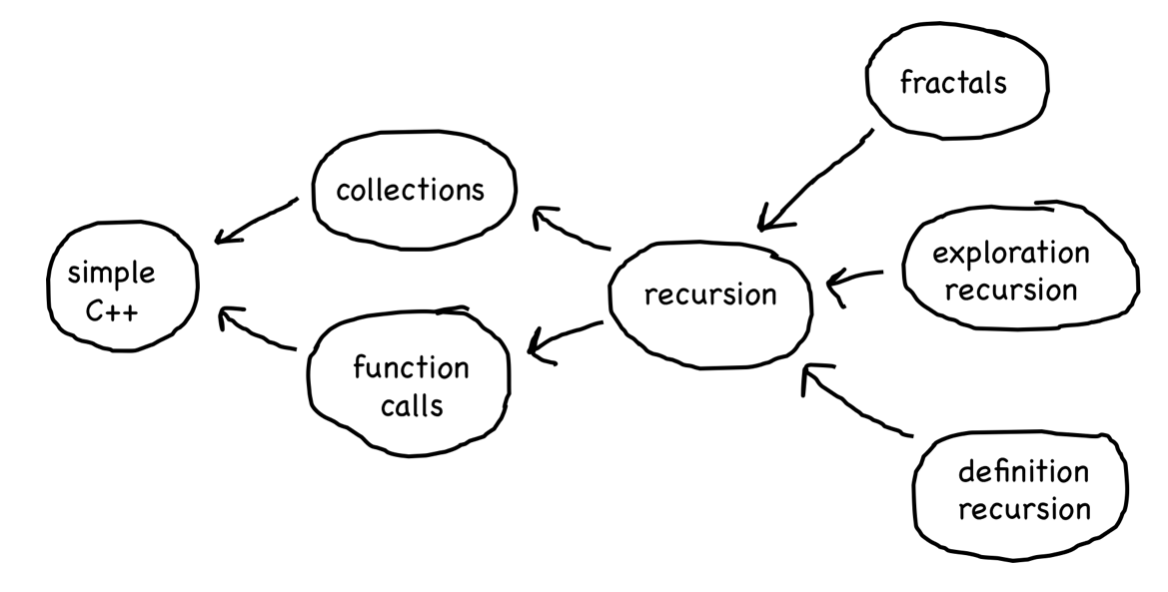
Today's Topics
- Graphs - the wild west of the node-based world
- How graphs are used for real-world problems
- Map direction-finding
- Dijkstra's algorithm
- A* Algorithm
- Internet routing and traceroute
- Social networks
- Product relationships (e.g., on Amazon)
- Routing circuits
- Map direction-finding
Slide 4
Graph Motivation 1
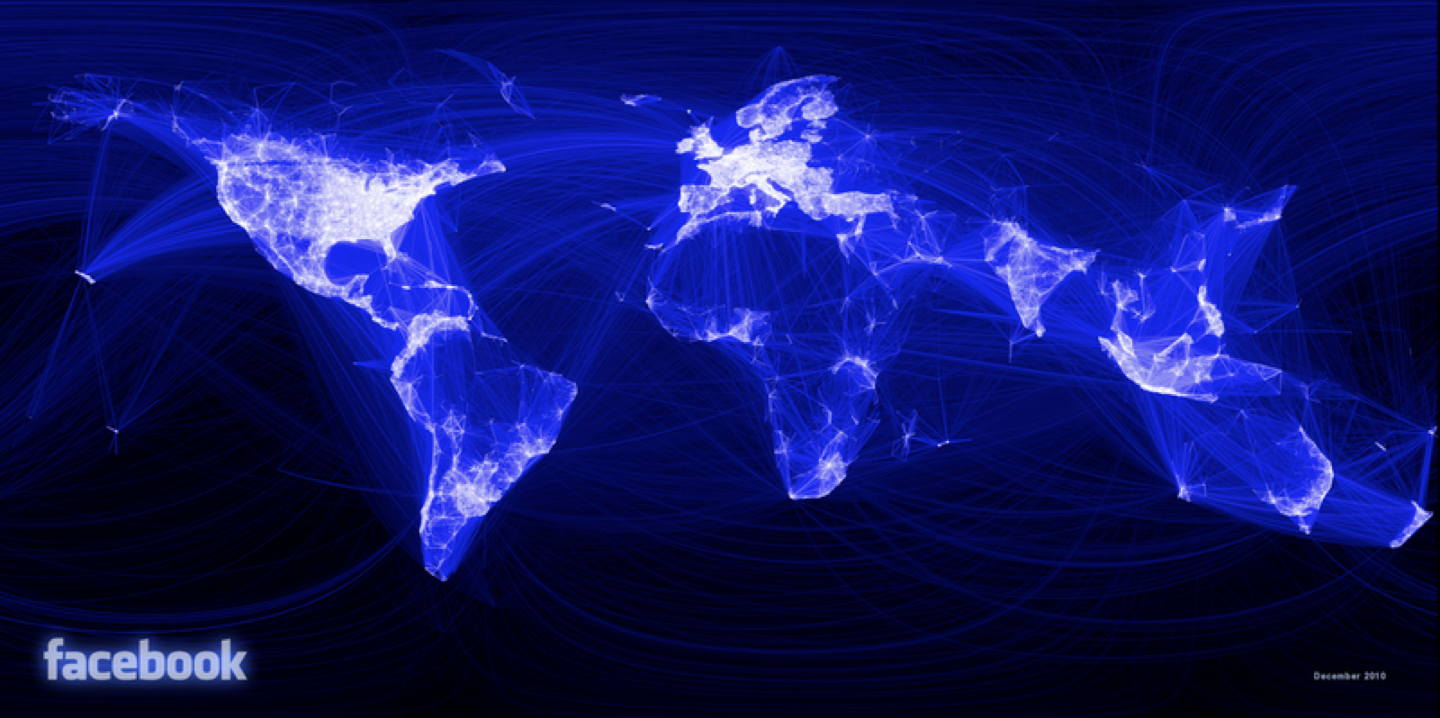
- Have you ever heard of a little company called Facebook? How about LinkedIn?
- Companies that connect people together use a social graph to do so. Facebook has the world's largest social graph, connecting well over a billion people together. Facebook keeps track of connections in a graph data structure, which we will discuss today.
Slide 5
Graph Motivation 2
- Have you ever wondered how your computer connects to other computers around the world?
- You can see how this works with the
traceroutecommand (Mac/Linux) or thetracertcommand (Windows). - Let's look at connecting from Stanford to the University of New South Wales, in Australia:
$ traceroute www.engineering.unsw.edu.au traceroute to www.engineering.unsw.edu.au (149.171.158.125), 30 hops max, 60 byte packets 1 csee-west-rtr-vl3804.SUNet (171.67.64.2) 0.296 ms 0.287 ms 0.275 ms 2 xb-nw-rtr-vlan2.SUNet (171.64.255.130) 0.441 ms 0.419 ms 0.413 ms 3 hpr-svl-rtr-vlan3.SUNet (171.66.255.147) 1.007 ms 0.997 ms 0.985 ms 4 hpr-svl-hpr3--stan-100ge.cenic.net (137.164.27.60) 1.024 ms 1.013 ms 1.045 ms 5 aarnet-2-is-jmb-778.sttlwa.pacificwave.net (207.231.245.4) 18.490 ms 18.486 ms 17.747 ms 6 et-2-0-0.pe1.a.hnl.aarnet.net.au (113.197.15.200) 71.593 ms 70.828 ms 70.816 ms 7 et-2-1-0.pe1.sxt.bkvl.nsw.aarnet.net.au (113.197.15.98) 164.803 ms 164.611 ms 163.838 ms 8 et-3-3-0.pe1.brwy.nsw.aarnet.net.au (113.197.15.148) 163.997 ms 163.169 ms 163.981 ms 9 138.44.5.1 (138.44.5.1) 163.384 ms 164.376 ms 163.513 ms 10 libcr1-te-1-5.gw.unsw.edu.au (149.171.255.102) 164.283 ms 165.070 ms 164.893 ms 11 libdcsl1-swp-5.gw.unsw.edu.au (149.171.255.174) 164.322 ms ombdcsl1-swp-5.gw.unsw.edu.au (149.171.255.194) 164.923 ms libdcsl1-swp-5.gw.unsw.edu.au (149.171.255.174) 164.380 ms 12 srdh5it8r22blfx1-ext.gw.unsw.edu.au (129.94.0.32) 163.981 ms srdh4it2r26blfx1-ext.gw.unsw.edu.au (129.94.0.31) 165.176 ms 165.102 ms 13 dcfw1-ae-1-3065.gw.unsw.edu.au (129.94.254.76) 164.405 ms 164.210 ms 165.111 ms 14 engplws011.ad.unsw.edu.au (149.171.158.125) 165.852 ms 164.604 ms 165.161 ms - It takes three hops just to get out of Stanford University. This is because there are a lot of computers at Stanford, and many smaller networks inside the school.
- After the first three hops, we get to a site called
cenic.net. This is the Corporation for Education Network Initiatives in California (CENIC), a nonprofit corporation formed in 1996 to provide high-performance, high-bandwidth networking services to California universities and research institutions (source: Wikipedia) - After that the next hop is to
sttlwa.pacificwave.net, whose job is "to pass Internet traffic directly with other major national and international networks, including U.S. federal agencies and many Pacific Rim R&E networks"
- The world's first undersea cables were in the 1850s (!) in the U.K. (under the English Channel) and linking non-land-locked countries in Europe. They were used to send Morse code.
- The first Transatlantic cable that was successful was laid in 1865, with 2300 miles of cable spools, laid from England to Newfoundland.
- The next stop is Australia! How does this happen? Under the sea!
- Once the route gets to Australia, it takes four more hops to get to the University of New South Wales, and then four more hops to get to the computer I finally wanted to get to, in the engineering department.
- The time to get to the final computer is 165 milliseconds.
- Why don't we just use satellites?
- Reason 1: Expense–satellites are so expensive, that it is cheaper to lay actual cable under the ocean.
- Reason 2: Time–most communications satellites are in geostationary orbit, 22,236 miles away from Earth. Because of speed-of-light limitations, it takes almost 1/8th of a second (120ms) to get a signal from Earth to the satellite, and another 1/8th of a second to get back. This means that the total round-trip time is at least 240ms, which is slower than an undersea cable, which has to to less than 10,000 miles (instead of over 40,000 miles)
- Reason 3: Bandwidth–modern undersea cables use fibre-optic cables, which can transmit a tremendous amount of data quickly. Satellites have limited bandwidth and cannot compete.
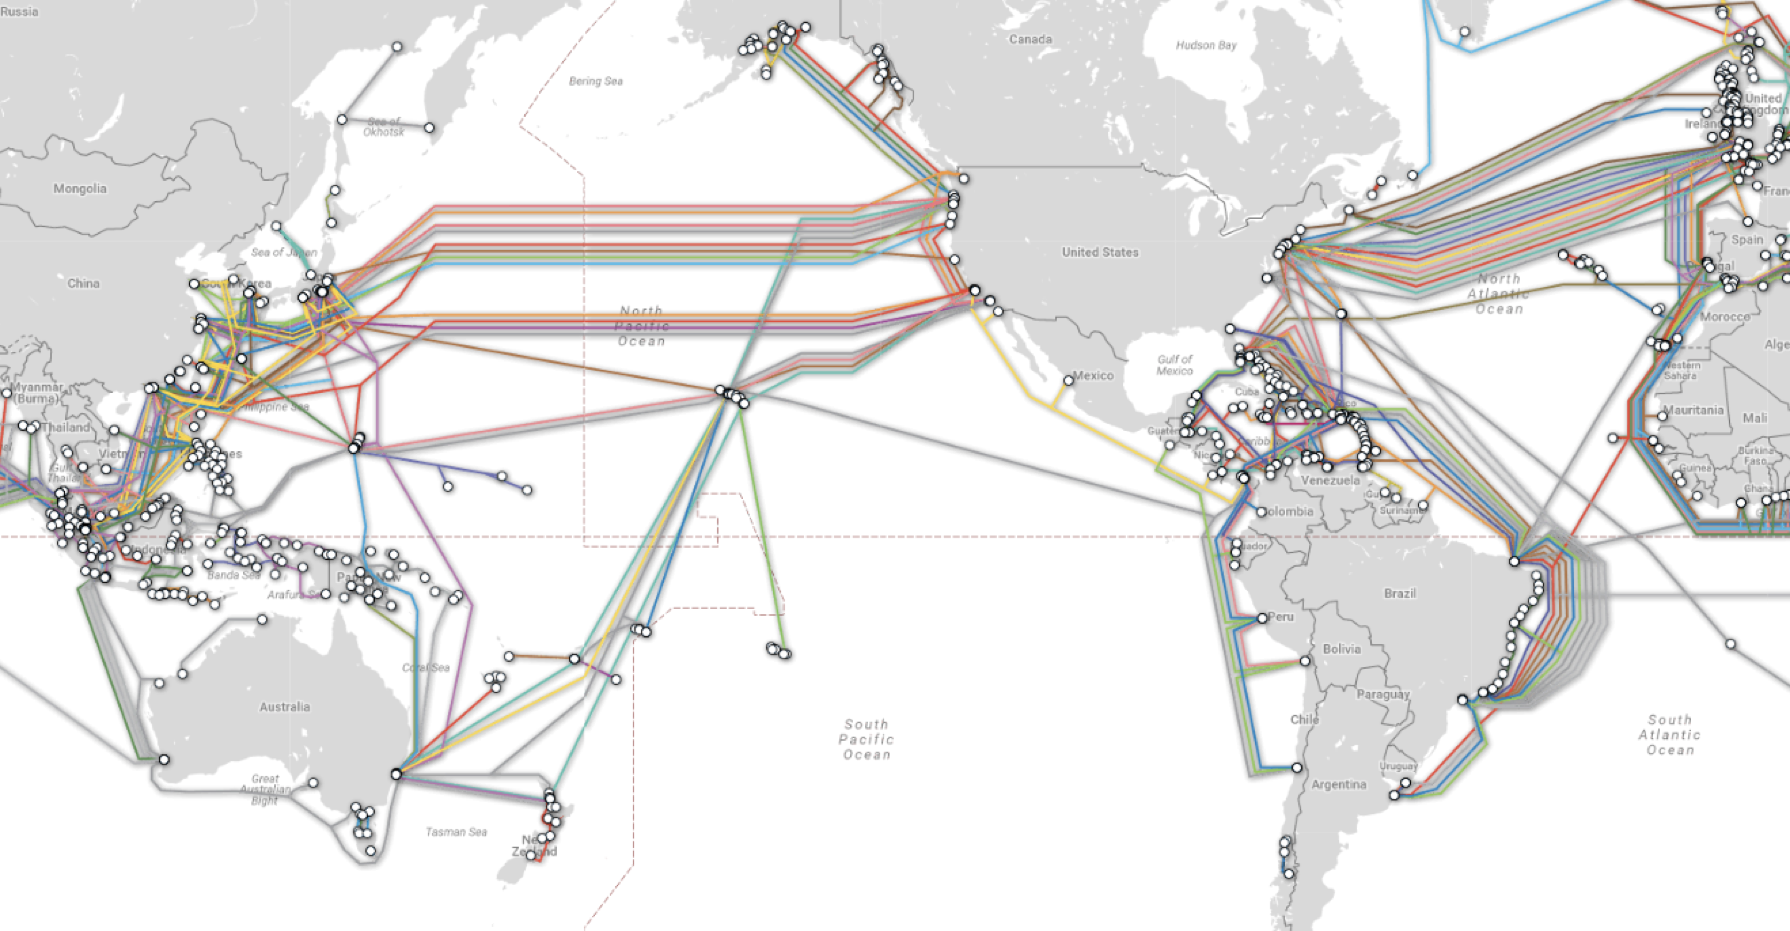
- The bottom line (no pun intended): computer networks are graphs, and managing these graphs enable us to connect the world's computers together.
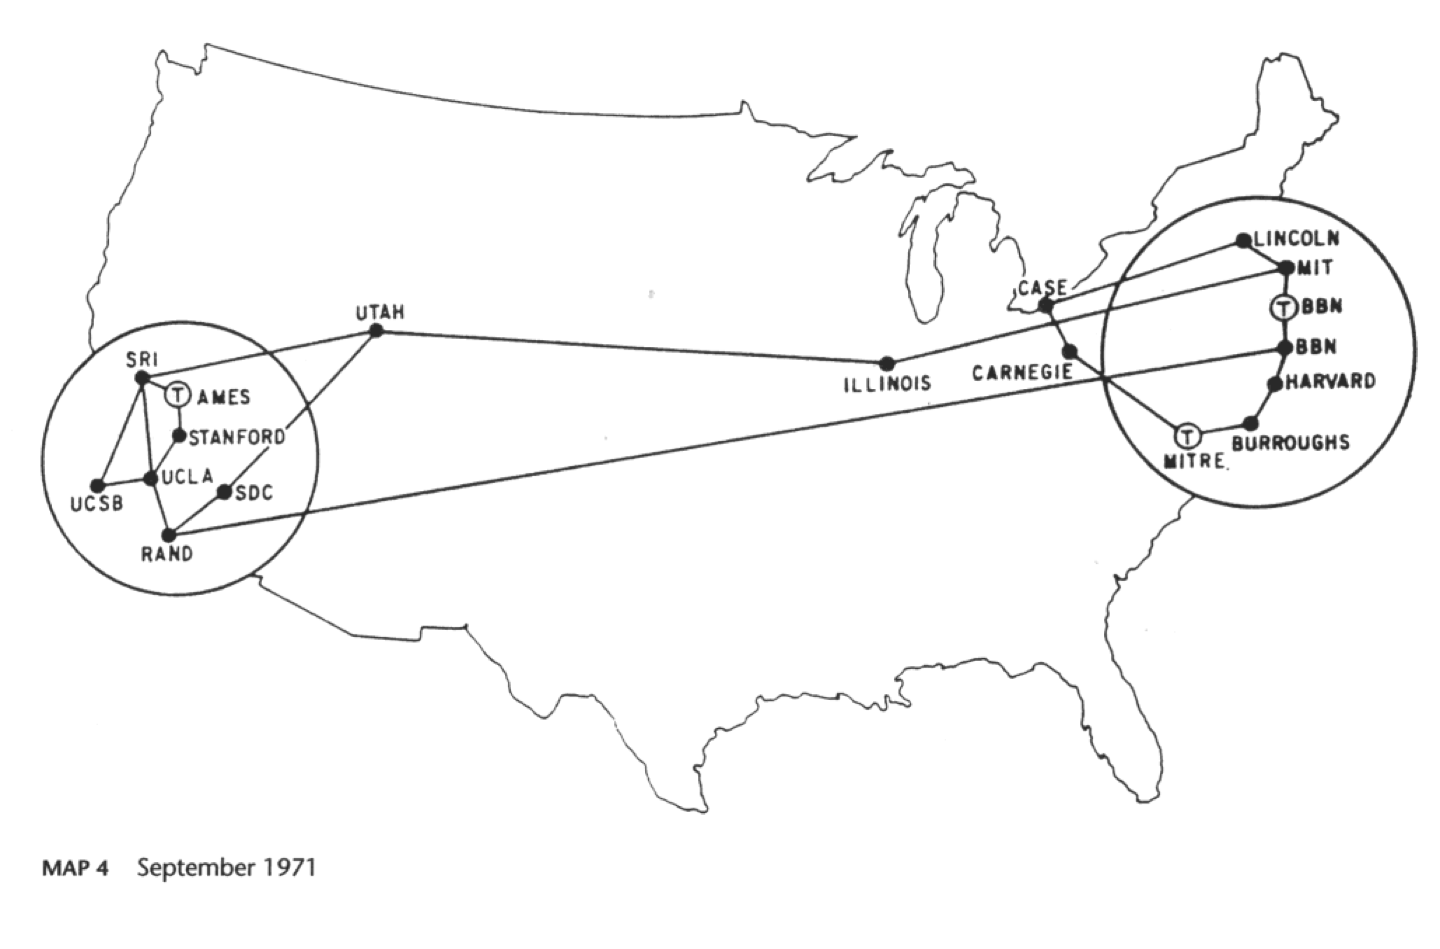
- Originally, the Internet was only a few nodes:
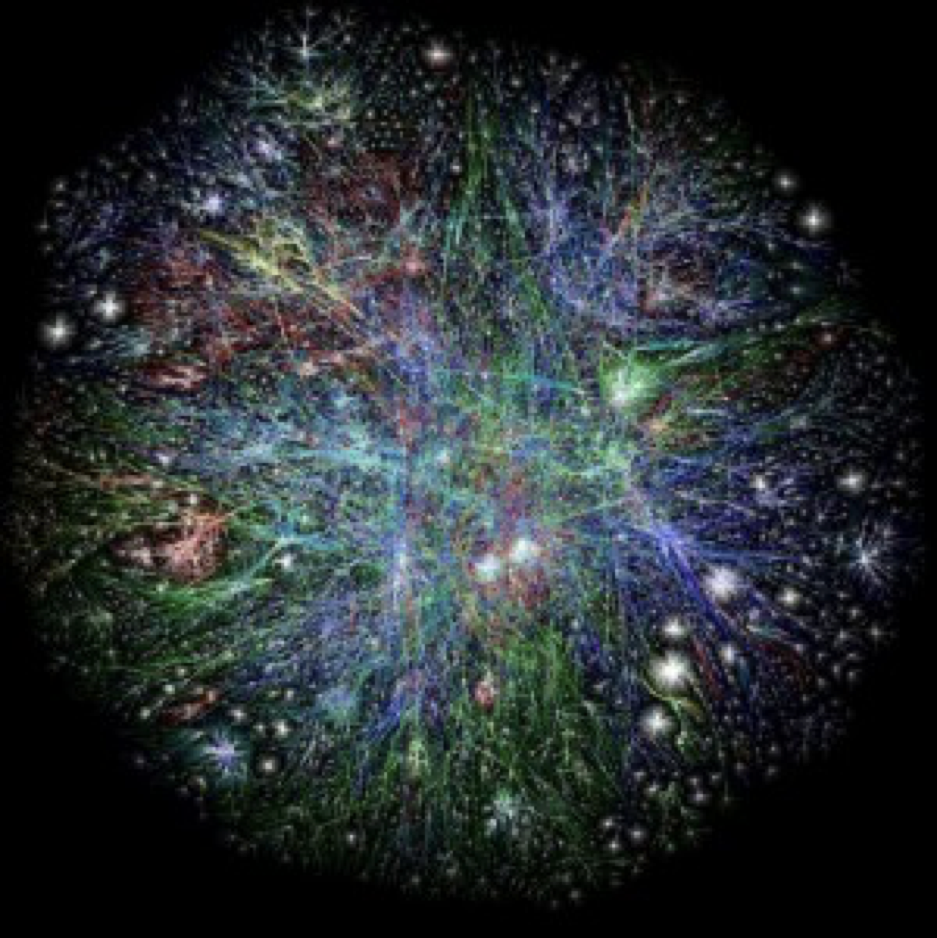
- Today's Internet has 20 billion+ nodes:
Slide 6
Graph definition
-
This was our tree definition:

-
Now that we are talking about graphs…
- A graph is a mathematical structure for representing relationships using nodes and edges.
- This is just like a tree, but without any rules! I like to call graphs the wild west of the node-based world.
- With graphs, we don't have any more notion of parents and children, and we allow cycles.
Slide 7
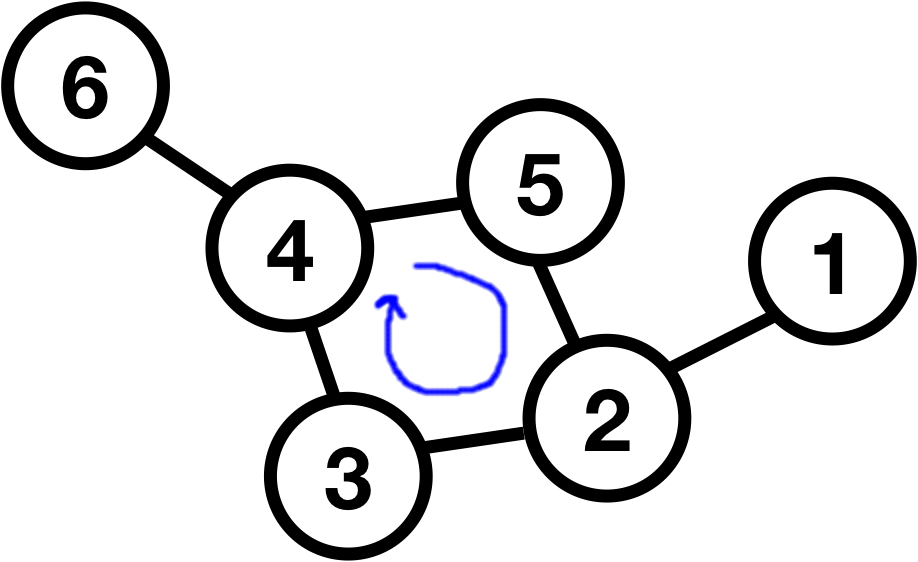
Graphs can have cycles
- Graphs do not have any notion of a parent-child relationship, and they can have cycles:
Slide 8
Graphs do not have roots
- Graphs also do not have roots:
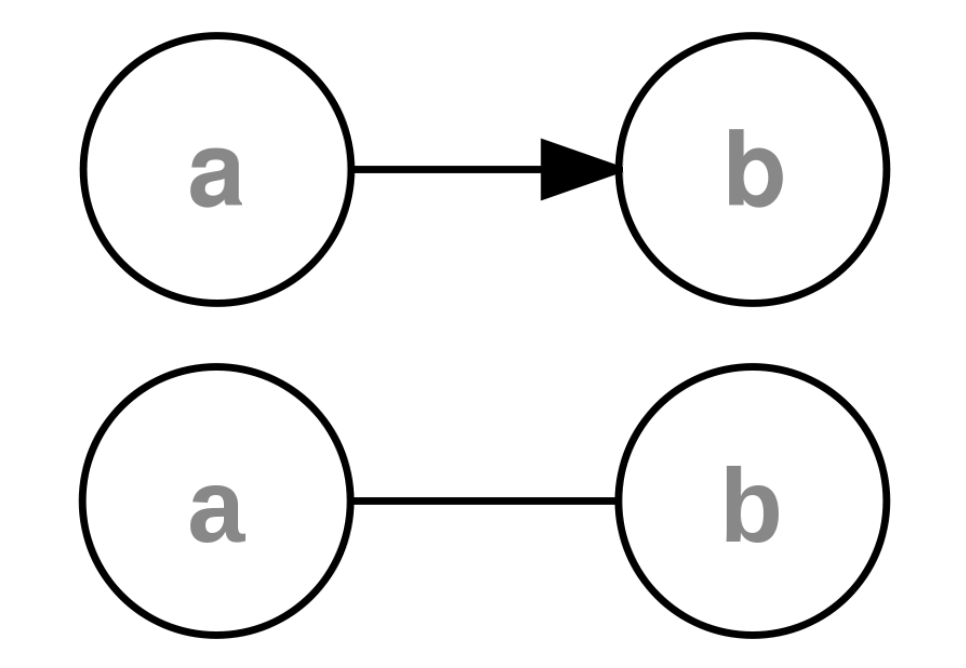
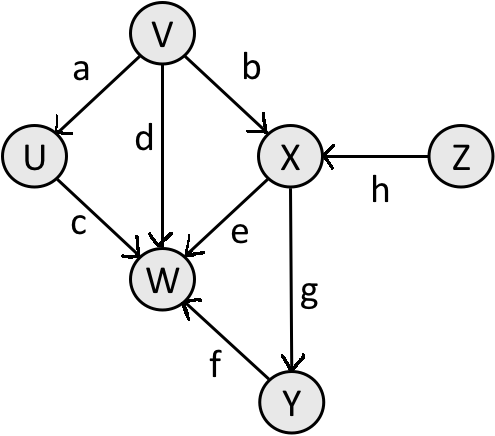
- Notice that graphs can also have directed edges, which means that you can get from one node to another but not necessarily in the other direction:
Slide 9
Weighted Graphs
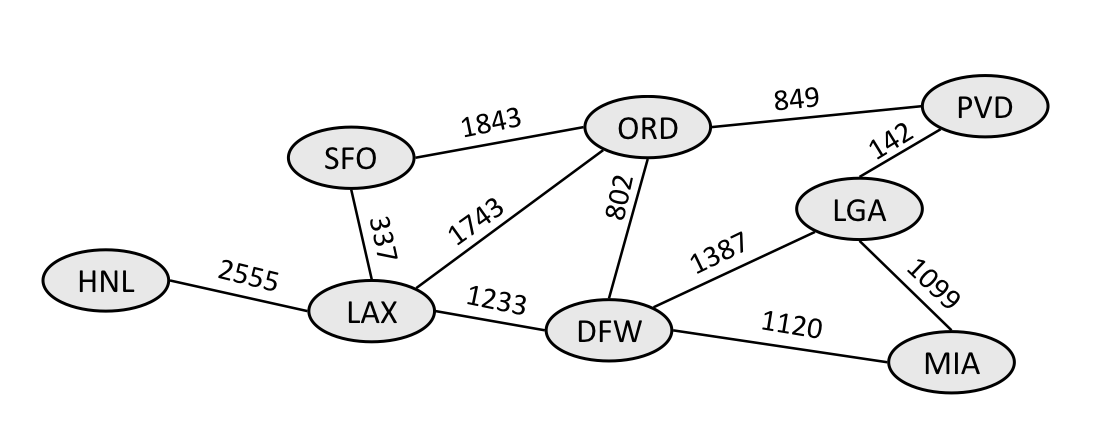
- A graph is considered weighted if it has numbers associated with edges. Weighted graphs are particularly useful for applications such as mapping between two locations, to take into consideration traffic, distance, time, etc.
- This is an example weighted graph of airline flights, with the weights representing the miles between airports.
Slide 10
Different types of graphs: prerequisite graph
- Graphs can also represent prerequisites:
Slide 11
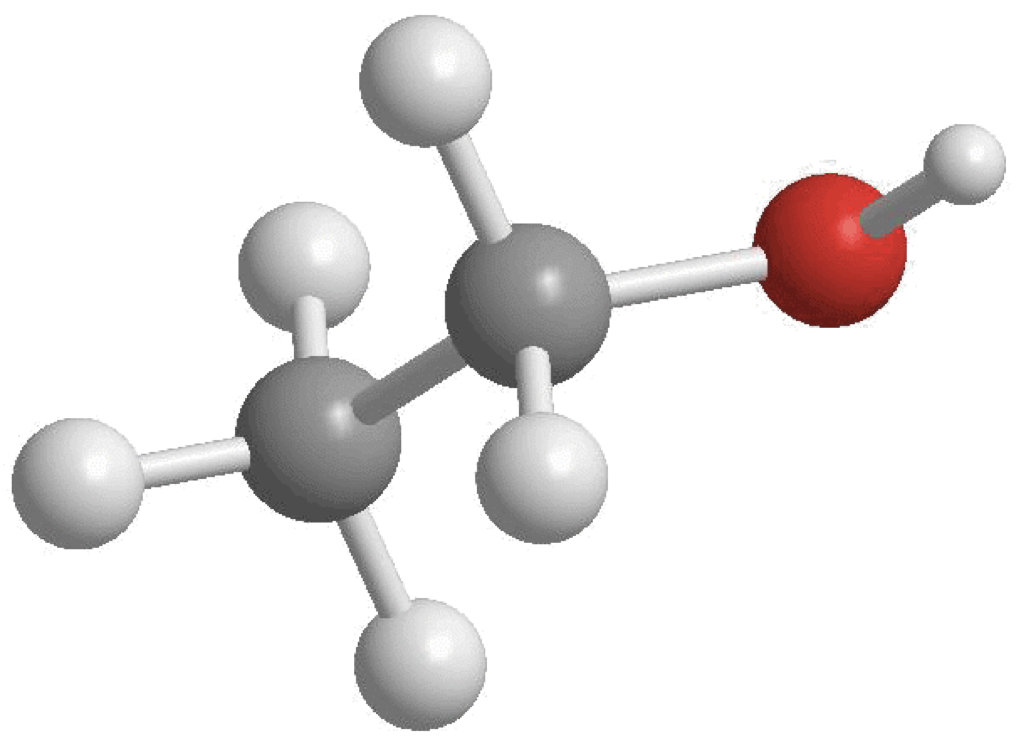
Different types of graphs: chemical bonds
- A graph can be used to represent chemical bonds (even the drawings you are familiar with have nodes and edges). Ethanol is shown below:
Slide 12
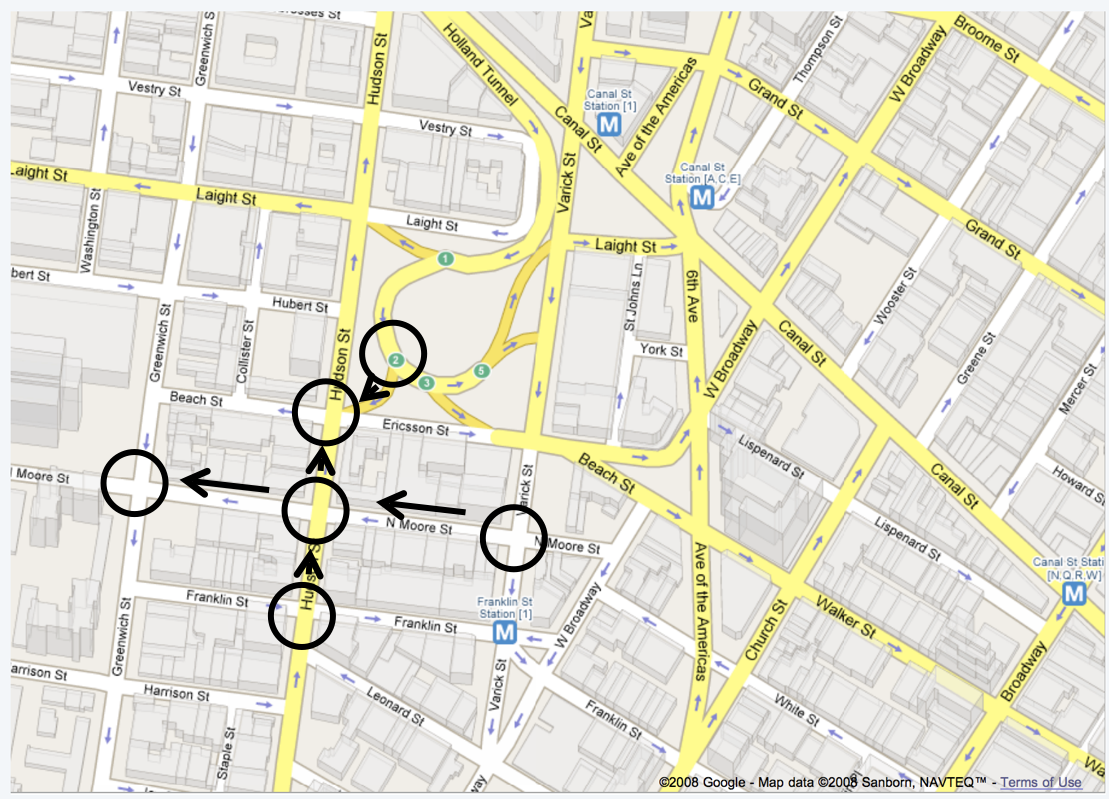
Different types of graphs: road maps
- A graph can be used to represent road maps, which is particularly effective for applications such as Google Maps:
Slide 13
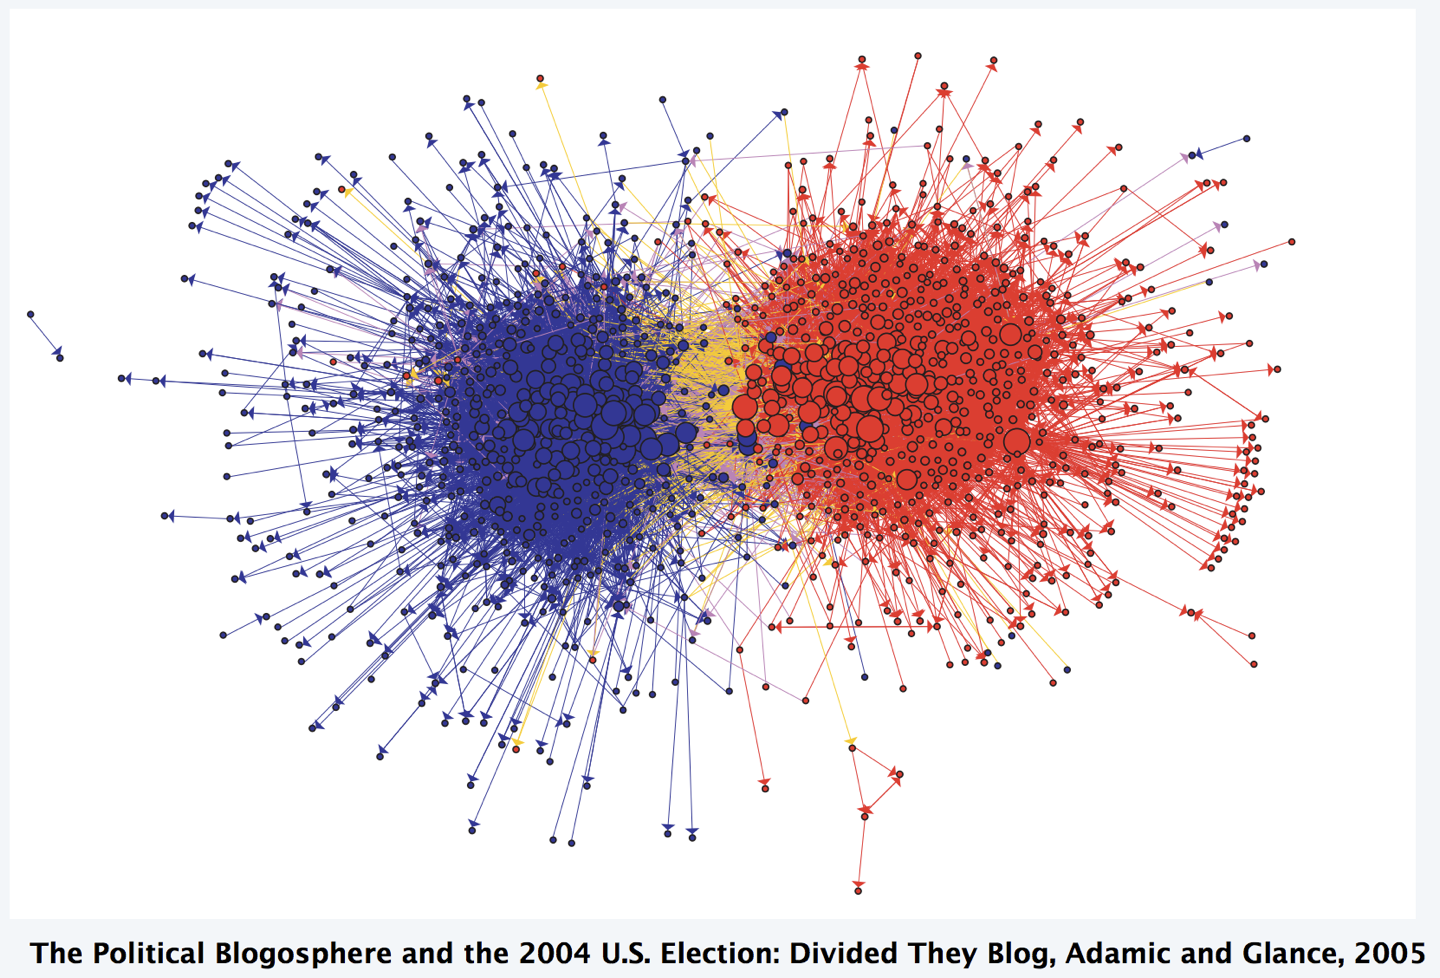
Different types of graphs: partisanship
Slide 14
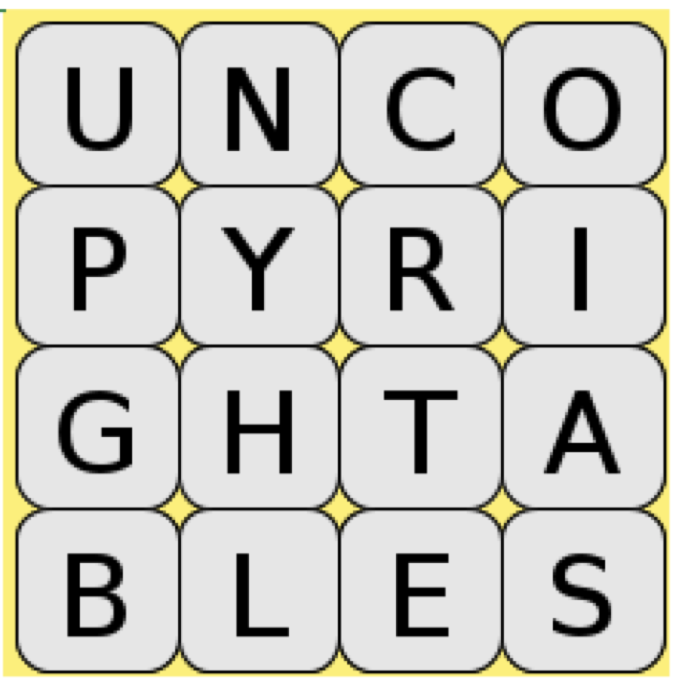
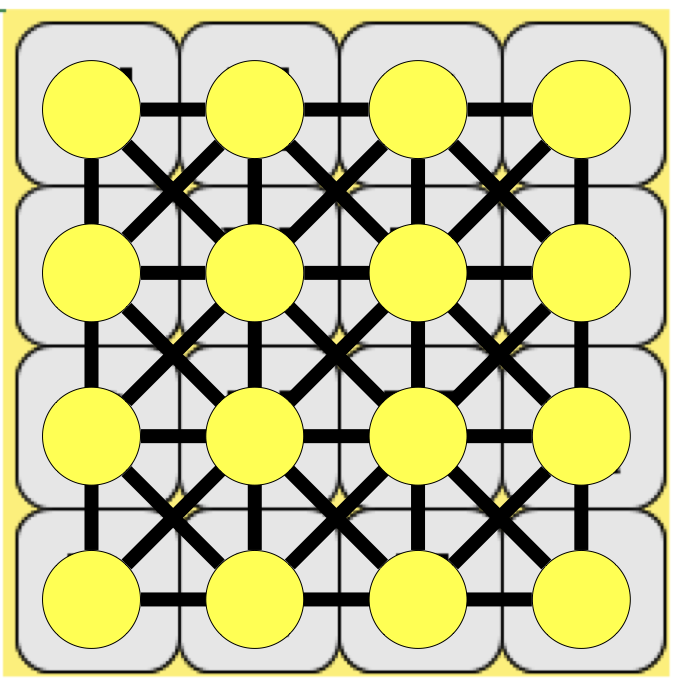
Different types of graphs: Boggle
- We can represent Boggle as a graph:
Slide 15
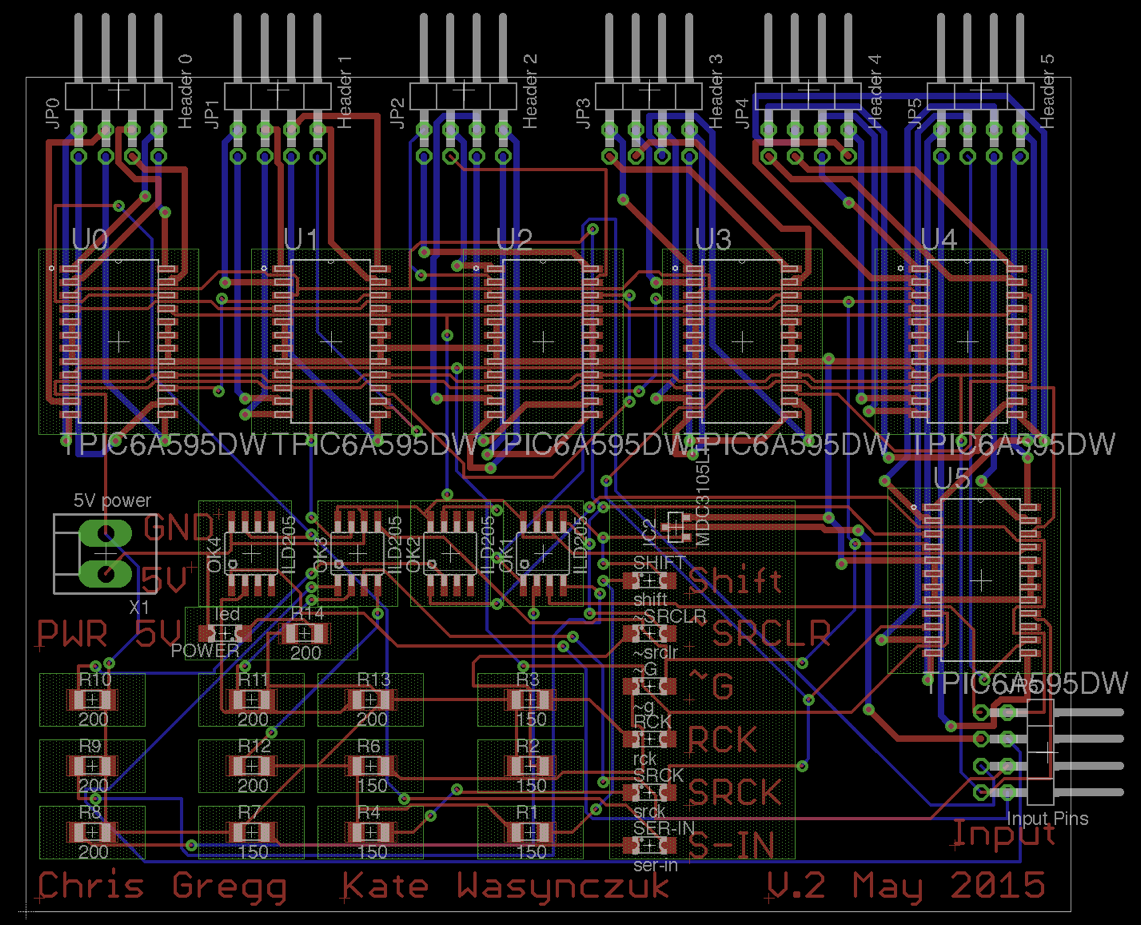
Different types of graphs: Circuit routing
- When designing circuits, you can have the computer try to "auto route" the circuit, and it uses a graph of all the connections to do so.
Slide 16
Different types of graphs: Amazon product relationships
- Amazon.com product relationships are graph-based
- When you search for an item, you get related items you might want to buy.
- For example, what did I search for to get these results?


Slide 17
Graph Terms
- node: the objects in a graph
- vertex: A vertex is another name for a node.
- edge: The connections between nodes.
- directed edge: An edge that only goes in one direction (e.g., from
atob) but not the other way. In a diagram directed edges are arrows. - undirected edge: An edge that can go in both directions (e.g., from
atoband frombtoa). In a diagram undirected edges are lines.
- directed edge: An edge that only goes in one direction (e.g., from
- path: A path from node
ato nodebis a sequene of edges that can be followed starting fromato reachb.- A path can be represented as nodes visited, or edges taken.
- In the diagram below, one path from
VtoZis{b, h}or `{V, X, Z}' - What are two paths from U to Y?
- path length: The number of nodes or edges contained in a path.
- neighbor or adjacent: Two nodes connected directly by an edge.
- Example below:
VandXare neighbors.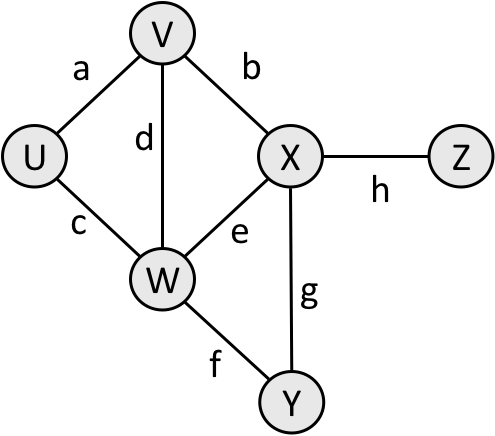
- Example below:
- A path from
UtoVand a path fromVtoZ: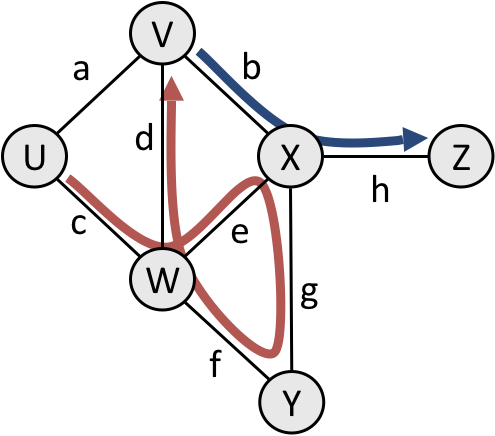
Slide 18
Loops and cycles
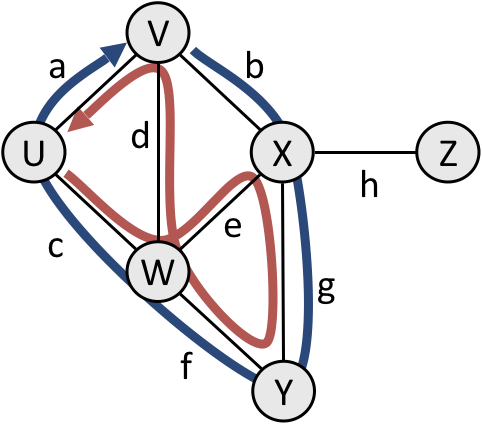
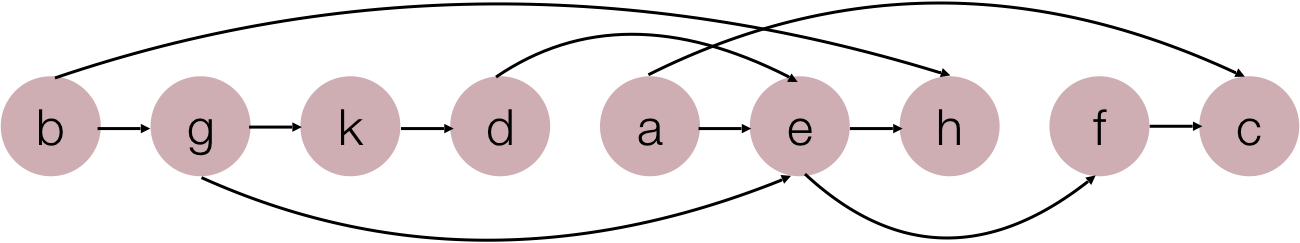
- cycle: A path that begins and ends at the same node.
- Examples below:
{b, g, f, c, a}or{V, X, Y, W, U, V}{c, d, a}orU, W, V, U
- Examples below:
- acyclic graph: a graph that does not contain any cycles
- loop: an edge directly from a node to itself
- Many graphs do not allow loops (you can't be friends with yourself on Facebook)
- Many graphs do not allow loops (you can't be friends with yourself on Facebook)
Slide 19
Reachability, connectedness
- reachable: A node is reachable from another node if a path exists between the two nodes.
- connected: A graph is connected if every node is reachable from every other node.
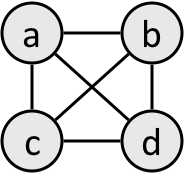
- complete: A graph is complete if every node has an edge to every other edge (this grows as O(n^2))
- In the following graph, Z is not reachable from any node. Y is reachable from V, X, Y, and Z, but not U or W.
- A graph that isn't connected:
- A complete graph:
Slide 20
Representing Graphs in Code
- There are a number of different ways to represent graphs.
- The Stanford library has the
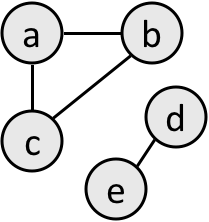
BasicGraphclass, which allows you to add nodes and edges. E.g,#include "basicgraph.h" BasicGraph graph; graph.addNode("a"); graph.addNode("b"); graph.addNode("c"); graph.addNode("d"); graph.addEdge("a", "c"); graph.addEdge("c", "b"); graph.addEdge("b", "d"); graph.addEdge("c", "d");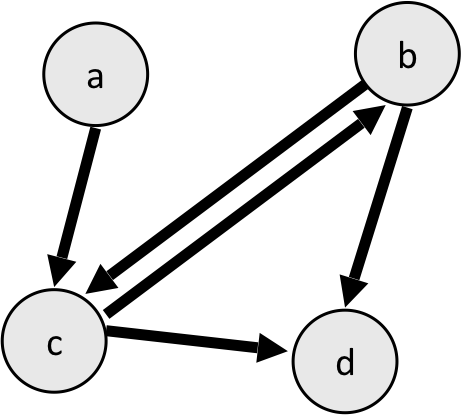
- The Stanford library has the
- The
BasicGraphalso has functions for finding a set of all edges, whether two nodes are neighbors, and others. - Another way to represent a graph is through an adjacency matrix. An adjacency matrix is a square matrix that represents all edges. For the graph above, the adjacency matrix would be as follows:
0 0 1 0 0 0 1 1 0 1 0 1 0 0 0 0 Row 0 represents a Row 1 represents b Row 2 represents c Row 3 represents d The columns represent a, b, c, d- a has an edge to c only, so row 0 is
0 0 1 0 - b has an edge to c and d, so row 1 is
0 0 1 1 - c has an edge to d only, so row 2 is
0 0 0 1 - d has no outgoing edges, so row 3 is
0 0 0 0
- a has an edge to c only, so row 0 is
- A third way to represent a graph is through an adjacency list. An adjacency list represents each node with a list of its neighbors. There are many different forms of adjancency lists. One might look like this for the graph above:
a: c
b: c, d
c: d
d: <none>
Slide 21
Graph Algorithms
- There are many, many different graph algorithms
- Some of the famous examples are:
- Dijkstra's algorithm and the A* algorithm, and Breadth-First-Search
- These are path-finding algorithms for weighted graphs that are used for finding the shortest path between points. They are significant for applications like Google Maps. Here is a great animation
- Kruskal's algorithm for finding a minimum spanning tree
- This algorithm creates a tree from a graph such that there is the least possible weight between any two nodes.
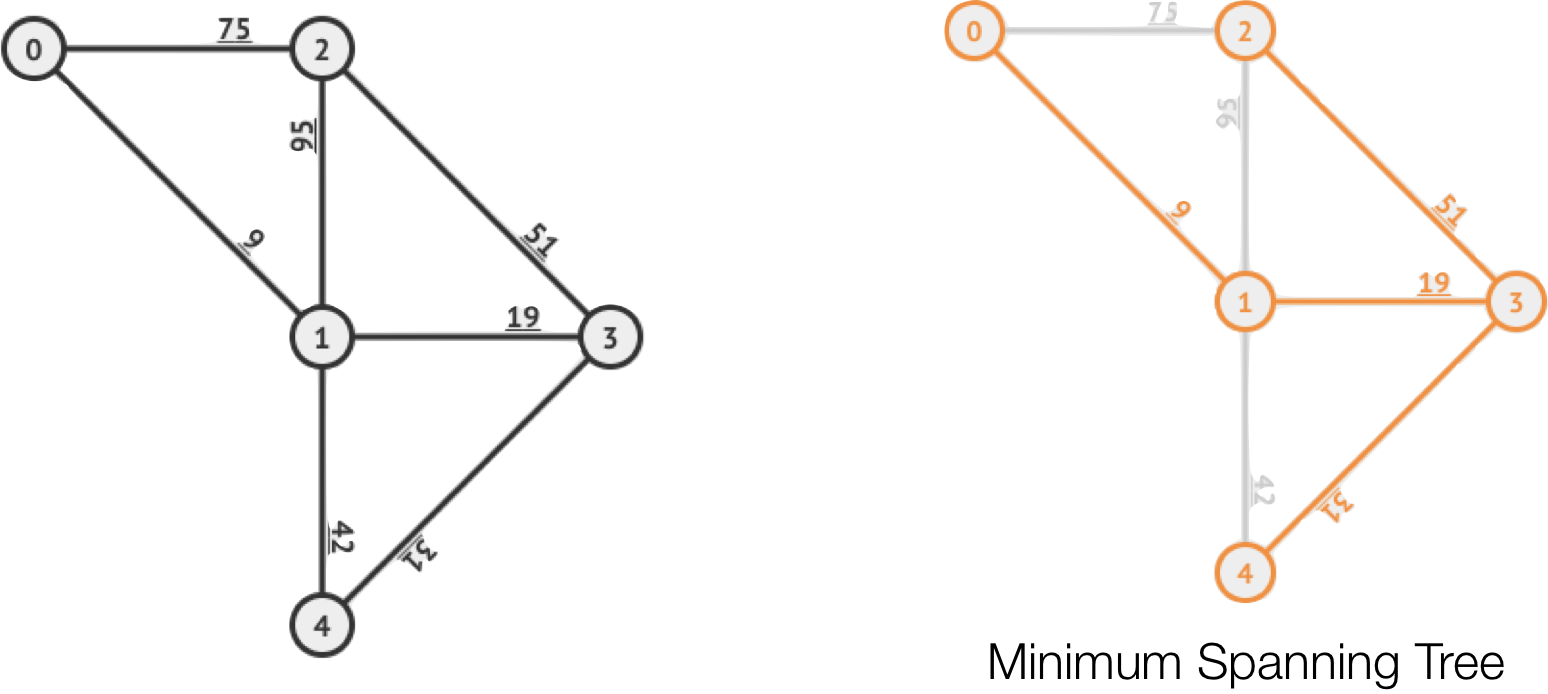
- This algorithm creates a tree from a graph such that there is the least possible weight between any two nodes.
- Topological Sort
- A topological sort allows scheduling of work based on dependencies between nodes (e.g., when doing laundry, the washer must finish before the dryer, and before folding).
- A topological sort allows scheduling of work based on dependencies between nodes (e.g., when doing laundry, the washer must finish before the dryer, and before folding).
- The traveling salesman problem
- There are many algorithms to solve this problem, but none are efficient. The problem asks, "Given a list of cities and the distances between each pair of cities, what is the shortest possible route that visits each city and returns to the origin city?" The cities are modeled as an undirected graph.
- Dijkstra's algorithm and the A* algorithm, and Breadth-First-Search