|
|
|
Reaction Time to Spatial Frequency Measured with the Point Process MethodRobert F. Dougherty and Deborah E. Giaschi
|
|

Purpose. Our main goal was to measure simple reaction time (RT) to stimuli of various spatial frequencies. We used a new RT paradigm based on the point process method (Simpson 1997; Simpson et. al. 1998) described below.
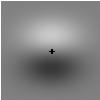
Methods. The point process method involves measuring a system's response to stimuli occurring at random times. The cross correlation of the stimulus time series with the response time series provides the impulse response of the system. Our stimuli were 1.5 degree Gabor patches (foveal viewing, 13 ms duration) that were presented periodically with exponentially distributed random delays between presentations (a Poisson point process). The observer's task was to press a key as soon as possible after each stimulus presentation. The exact time of each stimulus and each response was recorded. The average wait time between stimuli was approximately 3 seconds and the run length was 1 to 3 minutes. Eight runs were collected at 6 spatial frequencies between 0.5 and 16 cpd for 3 observers. Mean luminance was 10 cd/m2. Each Gabor was presented at a contrast that was 2 to 3 times the detection threshold for each observer. Detection thresholds were determined by a 2IFC staircase with stimuli identical to those used in the RT study. (Examples of the stimuli are shown above.)
Results. The peak of the cross correlation of the stimulus and response time series provided an estimate of the observer's RT. RT was as low as 300 ms for 0.5 cpd and increased by about 20 ms per octave of spatial frequency. These results are similar to those obtained by more traditional RT methods (Greenlee & Breitmeyer 1989).
Conclusions. The point process method is an efficient way to measure simple RT. It is more ecologically valid than traditional RT methods because real events that require a quick response are generally not preceded by a warning tone and do not come in discrete trials.
- Simpson, W.A. (1997). personal communication.
- Simpson, W.A., Braun, W.J., Bargen, C. & Newman, A.J. (1998). Investigative Ophthalmology & Visual Science, 39, S405.
- Greenlee, M.W. & Breitmeyer, B.G. (1989). A choice reaction time analysis of spatial frequency discrimination. Vision Research, 29, 1575-86.
References: