[Menu] [Previous] [Next]
TUTORIAL: Clinical PET - Cardiology
Use the "Menu" button to jump to the Let's Play PET Main Menu or click on the Next and Previous buttons to proceed sequentially through the topics and tutorials. Or, you can return to the Department of Molecular and Medical Pharmacology's Home Page.Contents:
Topics:
Myocardial Viability - Mismatch
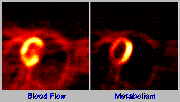
Cardiac PET is a very useful tool for the assessment of myocardial metabolism and perfusion. Two tracers serve as the mainstay for clinical diagnosis:
- Ammonia for the assessment of regional perfusion, which allows for the detection of regions of myocardium with decreased blood flow.
- FDG for the assessment of regional glucose metabolic rate, which is one measure of the metabolic activity of the myocardium.
Click on image above to view full-size image.
Mismatch is a term that refers to differences in tracer distribution when comparing images obtained using two different tracers. Mismatch is often used to designate regions of myocardium where there is a decrease in blood flow and a corresponding increase in glucose metabolism. Such regions are important clinically, because they signify areas where there is viable tissue (as evidenced by persisting glucose metabolism) despite the decreased blood flow. Through intervention, these areas can have perfusion re-established, and in time the metabolic pattern of the myocardium can again become more homogenous. An area where there is both decreased blood flow and decreased or absent metabolism (a match) signifies a region where there is probably little viable tissue. Such an area would be unlikely to benefit from re-establishment of flow. Patients with the most pronounced perfusion-metabolism mismatches are expected to have the greatest improvement in ventricular function following revascularization.
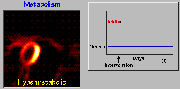
Click on image above to view full-size image.
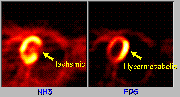
Mismatch is characterized by a region of diminished flow (ischemia) and corresponding hypermetabolism. This pattern is shown above in an N-13 ammonia scan (blood flow) and a corresponding FDG scan (metabolism). This pattern indicates that the region of tissue with decreased flow is still viable.
Click on one or both of the images above to view full-size image(s).
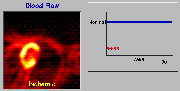
Shown above are N-13 ammonia images from a patient scanned over the course of 50 days. Initially the patient is ischemic in the lateral myocardial wall. After surgical intervention, there is good restoration of flow to the ischemic region, with a return to nearly normal flow values.
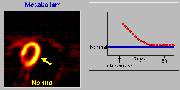
Click on one or both of the images above to view full-size image(s).
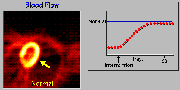
Shown above are FDG images from the same patient scanned over the course of 50 days. The lateral myocardial wall shows an area of hypermetabolism relative to the rest of the myocardium. After surgical intervention, there is return to near normal for the metabolic pattern of the lateral wall. Surgically treated patients with mismatches have significantly better ventricular function, symptoms and prognoses than medically treated patients.
Using Polar Maps to Detect Mismatch
Now, let's examine how polar maps can also be used to enhance the visualization and localization of areas of mismatch. The polar maps that follow are derived by combining images from multiple planes so that information about the entire myocardium can be displayed in a single image. These polar maps can be thought of as the image that would be obtained if one took a 3-D cone shaped heart activity image and projected it onto a plane.
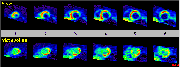
Click on image above to view full-size image.
Shown above are late-acquisition images of flow (NH3) and metabolism (FDG) through adjacent short-axis planes. The flow images show a lack of tracer uptake in the lateral wall, while the metabolic images show enhanced FDG utilization in the lateral wall. This pattern is known as a mismatch pattern and indicates the presence of viable tissue that is metabolically active, despite the poor perfusion.
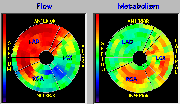
Click on image above to view full-size image.
The two images above are polar maps of blood flow and metabolism. They are obtained by combining information from all of the imaging planes. In these polar maps the FDG activity is normalized to the NH3 activity, so that they can be directly compared. The red areas represent highest activity, and the blue areas represent lower activity. The flow polar map indicates areas of decreased perfusion in the lateral and inferior portions of the myocardium. The metabolism polar map shows increased FDG uptake in these same regions. This pattern indicates a mismatch in flow and metabolism in the lateral and inferior portions of the myocardium. Note that by using polar maps the entire myocardium can be visualized in one image, as opposed to viewing images on a plane by plane basis.
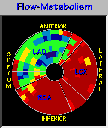
Click on image above to view full-size image.
Shown above is a polar map obtained by subtracting the flow polar map from the metabolism polar map. The red segments indicate areas of highest mismatch, whereas the blue areas represent areas of minimal mismatch (near-normal areas). This type of polar map is referred to as a flow-minus-metabolism polar map. In this case it is obvious that there is mismatch in the lateral and inferior segments of the myocardium.
Credits
Material for this section was kindly provided by:Johannes Czernin, M.D.
Dept. of Molecular and Medical Pharmacology
UCLA School of Medicine
Heinrich R. Schelbert, M.D., Ph.D.
Dept. of Molecular and Medical Pharmacology
UCLA School of Medicine
Richard C. Brunken, M.D.
[Menu] [Previous] [Next]