[Menu] [Previous] [Next]
TUTORIAL: Clinical PET - Cardiology
Use the "Menu" button to jump to the Let's Play PET Main Menu or click on the Next and Previous buttons to proceed sequentially through the topics and tutorials. Or, you can return to the Department of Molecular and Medical Pharmacology's Home Page.Contents:
Topics:
Parametric Imaging
The myocardial metabolic rate of glucose (MMRGlc) can be measured with positron emission tomography (PET) and 2-[18F]FDG using an appropriate modification of the technique originally developed by Sokoloff et al. for the measurement of cerebral glucose utilization. The method employs serially acquired images of FDG uptake and a Patlak graphical analysis of the image data. The approach is computationally fast enough to be used in a clinical environment. The MMRGlc parametric images improve myocardial contrast relative to non-parametric images, especially in studies with poor myocardial uptake of FDG. In addition, MMRGlc parametric images consolidate the large amount of data in a dynamic PET study into a clinically usable image set.

Click on image above to view full-size image.
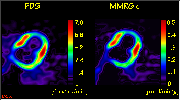
Shown above are two images. The image on the left is from an FDG scan obtained at about 50 minutes after injection, and is referred to as an FDG uptake image. Note that the units of this image are counts/pixel/min. The image on the right is of a type known as a parametric image. This image represents myocardial metabolic rate of glucose utilization (MMRGlc). The image on the right was obtained by using an FDG tracer-kinetic-model and a sequence of scans during which FDG distribution occurred. Note that the units of the image on the right are Ámol/min/g of tissue. Note the increased contrast, especially between blood pool and myocardium, in the parametric image. The advantage of a parametric image over a conventional tracer activity image is that it is quantitative and represents a specific biochemical or physiologic parameter (in this case myocardial metabolic rate of glucose utilization). Parametric images can have regions of interest (ROI's) placed on them, and regional parameter values thus can be ascertained directly. (Parametric images of blood flow can be obtained from N-13 ammonia dynamic scans.)

Click on image above to view full-size image.
The above left image represents NH3 distribution at approximately 10 minutes after injection. Note that the units for this image are counts per pixel per second. The image on the right represents a parametric image of myocardial blood flow (MBF). The image on the right was derived by using the information from a dynamic NH3 scan in conjunction with the NH3 tracer kinetic model to obtain a parametric image quantitating myocardial blood flow on a pixel by pixel basis in a given plane. Note that the units of the parametric image on the right are milliliters per minute per gram of tissue.

Click on image above to view full-size image.
Shown above are FDG tracer activity images at approximately 50 minutes post-injection. The image on the left was obtained by fasting the patient for 12 hours prior to the study, and the image on the right was obtained after the patient was a given a glucose rich supplement. The images appear relatively similar, except that the image on the left is somewhat noisier due to lower uptake of FDG by the myocardium.

Click on image above to view full-size image.
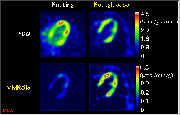
Now examine the fasting and postglucose tracer activity images (top) and their corresponding MMRGlc parametric images (bottom). Note that the parametric images clearly show the different glucose utilization rates in the fasting and postglucose states. MMRGlc for the global myocardium increased from 0.145 in the fasted state to 0.459 Ámole/min/g after glucose as demonstrated by the parametric images. The postglucose MMRGlc values are much higher because glucose is available for myocardial utilization in this state. These images illustrate the usefulness of parametric images in effectively studying the myocardium; MMRGlc parametric images will be clinically useful, particularly in conditions where estimates of the severity and geometric extent of metabolic abnormalities are important to define.
Credits
Material for this section was kindly provided by:Sanjiv Gambhir, M.D., Ph.D.
Crump Institute for Molecular Imaging
Dept. of Molecular and Medical Pharmacology
UCLA School of Medicine
Heinrich R. Schelbert, M.D., Ph.D.
Dept. of Molecular and Medical Pharmacology
UCLA School of Medicine
Sung-Cheng Huang, Ph.D.
Dept. of Molecular and Medical Pharmacology
UCLA School of Medicine
Randall A. Hawkins, M.D., Ph.D.
Nuclear Medicine Division
UCSF School of Medicine
Richard Brunken, M.D.
Yong Choi, Ph.D.
Dept. of Radiology
University of Pittsburgh School of Medicine
[Menu] [Previous] [Next]