[Menu] [Previous] [Next]
TUTORIAL: Clinical PET - Neurology
Use the "Menu" button to jump to the Let's Play PET Main Menu or click on the Next and Previous buttons to proceed sequentially through the topics and tutorials. Or, you can return to the Department of Molecular and Medical Pharmacology's Home Page.Contents:
Topics:
Neurological Scan Evaluation

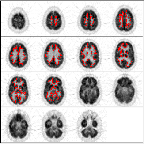
Click on image above to view full-size image.
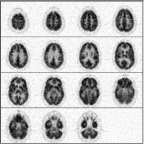
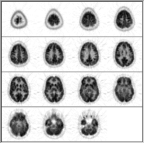
This is a normal PET scan. Abnormal PET scans will be compared with it in this tutorial about image quality control. The checklist on the right will be completed as we work through image quality control issues relating to neurological scan evaluation. This scan depicts fifteen planes (imaged simultaneously). The top of the brain begins in the upper left corner. Moving from left to right through each row, the final image is from the bottom of the brain.
Click on image above to view full-size image.
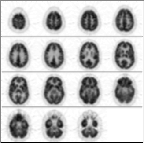
The first step in analyzing image quality is to look for artifacts. For example, this scan is too noisy.
Click on image above to view full-size image.
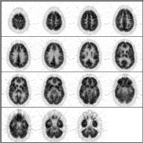
This scan is too smooth.
Click on image above to view full-size image.
This scan is just right! (with apologies to the author of "Goldilocks and The Three Bears")
Click on image above to view full-size image.
Note the streaks in plane 11. A failure in one or more detectors can cause this problem.
Click on image above to view full-size image.
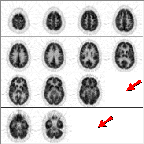
Note that two planes (12 & 15) are missing in this scan. Although the problem is obvious here, sometimes one will miss it. For example, many display routines allow the user to display a subset of the image planes. Unless each image in the subset is individually numbered, a novice user might assume that he or she is viewing a contiguous set of planes. The danger of this increases as the axial resolution is improved (i.e., as the the plane thickness is decreased) with newer PET scanners. This PET scan came from a tomograph capable of imaging a 6.75 mm thickness of tissue per plane.
Click on image above to view full-size image.
Another type of artifact is caused by normalization errors. A normalization error led to this dark-light pattern in direct (1,3,...) vs. cross (2,4,...) planes. "Normalization" refers to a balancing of the sensitivity or gain among all detector planes. By their geometry, direct planes have higher sensitivity than do cross planes.
Click on image above to view full-size image.
Lack of attenuation correction in the left image led to the characteristic "dip" in activity at the center of the skull (particularly in the striatum and thalamus). "Attenuation" refers to a weakening of the gamma-ray signal from an imaged site due to the presence of other structures. Bone causes higher attenuation than does soft tissue. Attenuation correction compensates for this weakening of the signal.
Click on image above to view full-size image.
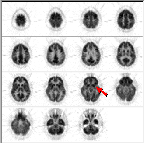
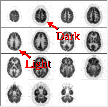
Another type of artifact is related to the placement of the patient in the scanner. To decide whether the head was tilted in the gantry, first locate the petrous ridges or bones. Normal bone has no FDG metabolism. The arrows point to the site of the petrous ridges (in plane 15 in this scan). The petrous bone appears in a PET brain scan as the absence of activity between the cerebellum and the inferior temporal lobe.
Click on image above to view full-size image.
The asymmetry in activity in the plane containing the petrous ridges implies that the head was tilted in this scan. When the head has been positioned properly the absence of activity that is caused by the petrous bones should be symmetrical between the left and right sides. In this example the right petrous bone (on the left side of the image) was in the image plane to a greater degree than was the left petrous bone (on the right).
Click on image above to view full-size image.
Once again, this is a normal PET scan. We will now learn how to distinguish abnormal from normal brain metabolism.
A convenient way to analyze metabolism in a brain FDG-PET scan is to proceed down a checklist of brain structures. This tutorial teaches such an approach.
Click on image above to view full-size image.
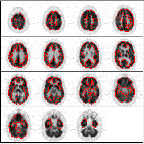
The first brain structure will will examine is the cerebral cortex. Red outlines the cortex in the above scan.
Note the normal pattern of cortical heterogeneity. Cortical heterogeneity appears as light & dark tissue regions. (Note that this scan is displayed such that darker regions represent higher metabolic activity than lighter regions.)
Note the side to side & the anterior to posterior consistency of FDG metabolism.
Click on image above to view full-size image.
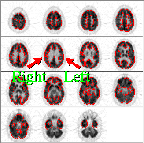
Neurological scans are normally presented with the right/left sides of the brain reversed with respect to the viewer. In an FDG-PET scan metabolism should be symmetrical from side-to-side.
Click on image above to view full-size image.
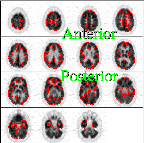
Likewise, metabolism should be similar between the anterior and posterior regions of the brain.
Click on image above to view full-size image.
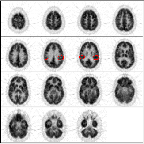
Note the relatively greater activity in motor cortex (shown in the image above)...
Click on image above to view full-size image.
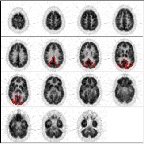
in visual cortex (shown in the image above)...
Click on image above to view full-size image.
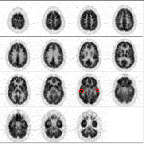
& in auditory cortex (shown in the image above).
Click on image above to view full-size image.
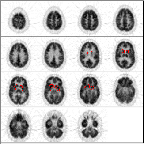
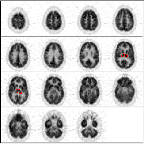
The basal ganglia, or striatum, is one of the most active brain structures. High metabolic acitivity in this region should not be confused with a pathological condition, such as a tumor.
Click on image above to view full-size image.
The thalamus is another brain region that exhibits relatively greater metabolic activity. Red outlines the thalamus in planes 8 & 9.

Click on one or more of the images above to view full-size image(s).
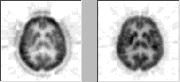
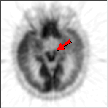
The brainstem is another region of relatively increased metabolism; it is not imaged well in this normal scan (on the left).The image on the right, from another scan, shows the brainstem.
Click on image above to view full-size image.
The cerebellum consists of a three-layered cortex and a set of deep cerebellar nuclei. The cerebellum receives information from visual, auditory, vestibular and somatosensory regions of the brain and serves to integrate this information, exerting a coordinating and smoothing effect on movements. See if you can locate the cerebellum in this scan.
Click on image above to view full-size image.
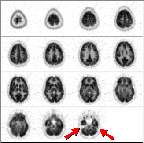
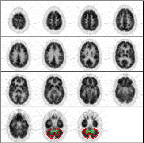
The cerebellum is imaged well in planes 14 & 15 of this scan. The cerebellar cortex is outlined in red, while the dentate nuclei, which are difficult to see at this magnification, are outlined in green.
Click on image above to view full-size image.
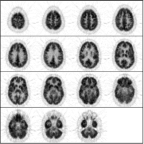
Finally, the white matter is outlined in some planes of this scan. The white matter of the brain consists primarily of glial cells and axons of neurons projecting to and from the cerebral cortex.
Credits
Material for this section was kindly provided by:Scott Grafton, M.D.
Dept. of Neurology and
Dept. of Radiology
University of Southern California
John Mazziotta, M.D., Ph.D.
Dept. of Molecular and Medical Pharmacology and
Dept. of Neurology
UCLA School of Medicine
[Menu] [Previous] [Next]