Comprehending Bechdel Data
Written by Elyse Cornwall, based on a section by Erin McCoy, Katie Creel, Diana Navas, and Juliette Woodrow.
List Comprehensions
Temps, Revisited
Let's revisit a problem from last section: we have a list of temperatures temps_f in Fahrenheit,
and we want to produce a list temps_c of those temperatures in Celsius.
temps_f = [45.7, 55.3, 62.1, 75.4, 32.0, 0.0, 100.0]
Last section, we saw how to
do this with map. Now, write a list comprehension to create the list temps_c.
Movie Tuples
Suppose we have a list of tuples representing movies, for example:
movies = [('alien', 8, 1), ('titanic', 6, 9), ('parasite', 10, 6), ('caddyshack', 4, 5)]
The first element of each movie tuple is the movie name, the second element is the overall score, and the
third element is the "date score" (how appropriate the movie is for a date). Write list comprehensions to
do the following, given some list movies like the one above.
- Produce a list of the second elements (overall scores) of each tuple.
- Produce a list of the sum of the second and third elements (overall score plus date score) of each tuple.
- Produce a list of the first elements (movie name) of each tuple, except that the first character of each name is made uppercase. You can assume that each movie name has at least one character, and don't worry about movie names that are multiple words.
Bechdel Test Data
A Short History
Named for Alison Bechdel, the Bechdel Test seeks to analyze the representation of women in fictional media. To pass the Bechdel Test, a film must fulfill three requirements:
- Feature two women
- Who have a conversation
- About something other than a man
Our Data
In this problem, we are going to use over a century of data to plot what percentage of movies pass the Bechdel requirements over time. This data comes from a database of over 9000 movies. We've got a data file in the following format:
Sherlock Holmes Baffled,0,1900
Pinocchio,1,1940
Anna Karenina,2,1948
Encanto,3,2021
Cruella,3,2021
Each line has a movie title, score between 0-3, and year. The score represents the number of Bechdel
requirements the movie passes, so 0 is none, and 3 is fully passing the Bechdel Test. We've turned this data
into a years dictionary where the key is a decade, and the value is a nested list. The four values
in
the list represent
how many movies from this decade pass 0, 1, 2, or 3 requirements of the Bechdel test. Here's the dictionary made
from the sample file shown above.
years = {
  1900: [1, 0, 0, 0],
  1940: [0, 1, 1, 0],
  2020: [0, 0, 0, 2]
}
See how Anna Karenina from 1948 passes two requirements, so the inner list for the 1940s has 1 at index 2. On the other hand, our file contains two movies from the 2020s that pass all three requirements, so index 3 of this list has count 2.
We've provided the code to read the file data into a years dictionary in a function called
read_file in the starter code, but implementing read_file yourself would be
great
practice for the final exam.
Plotting the Data
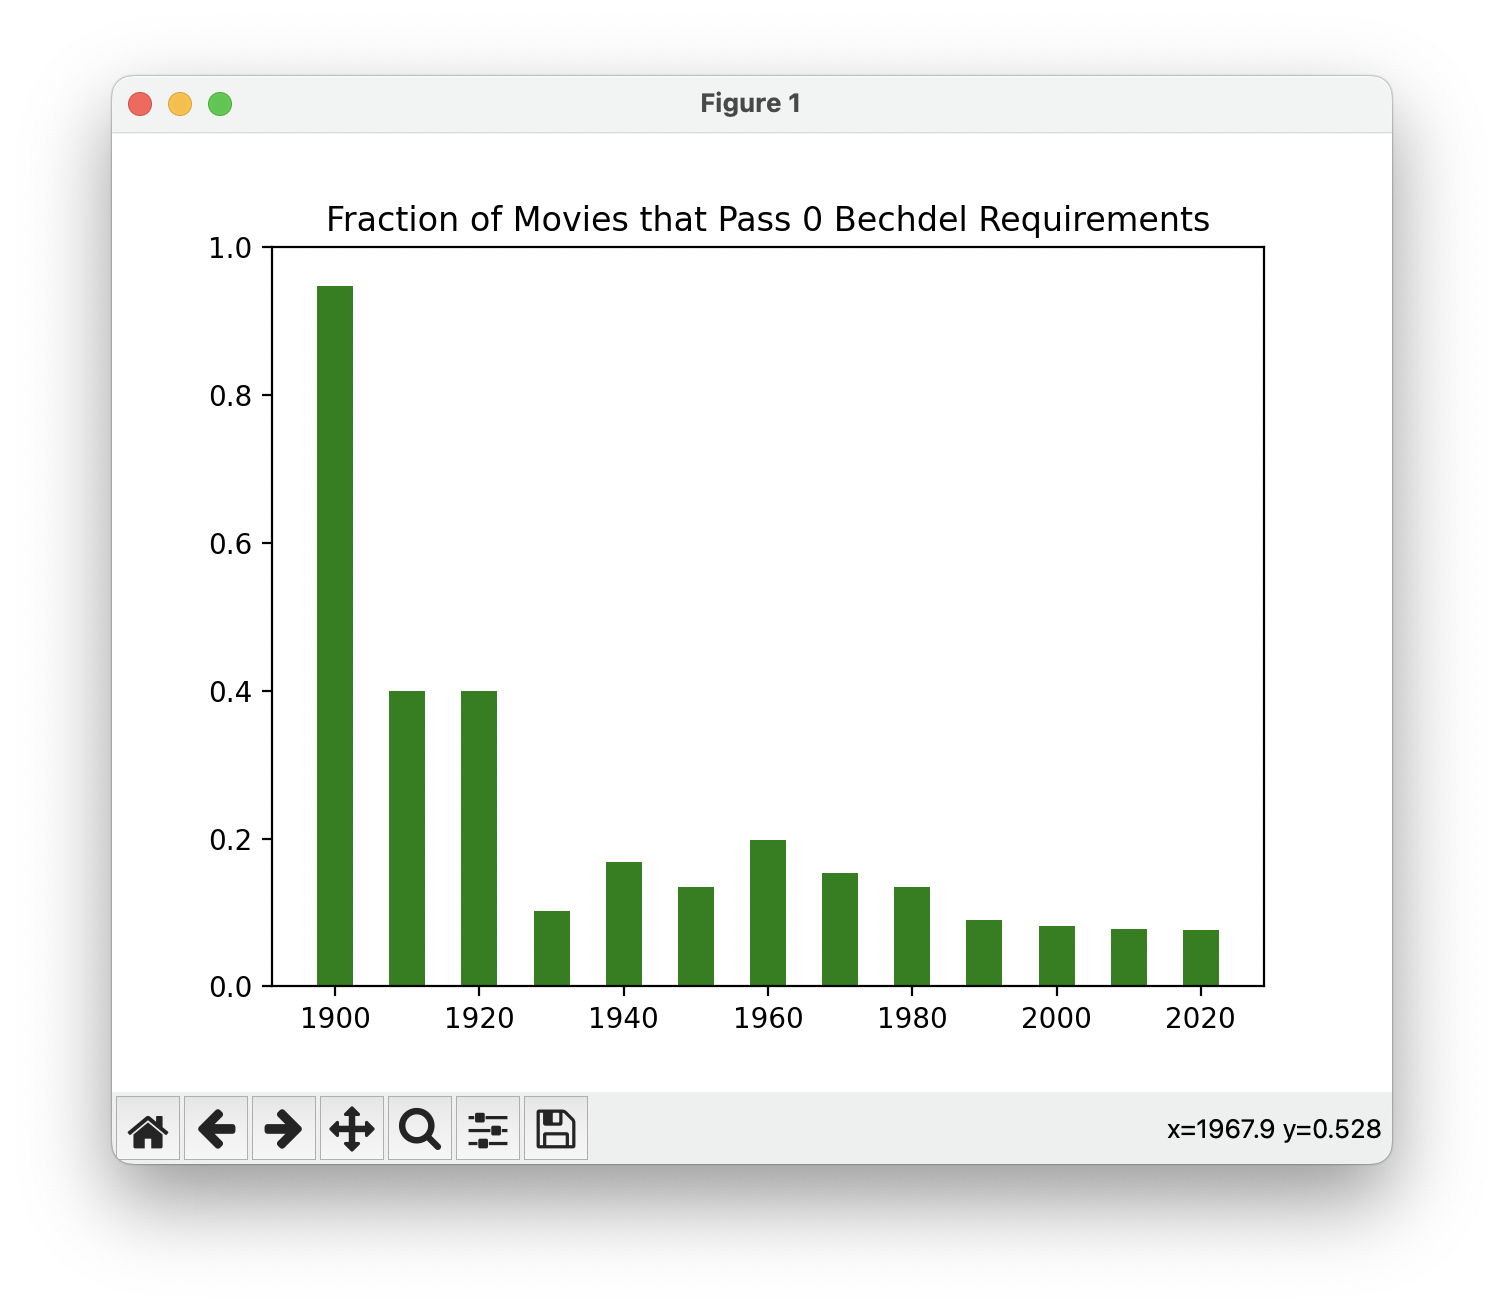
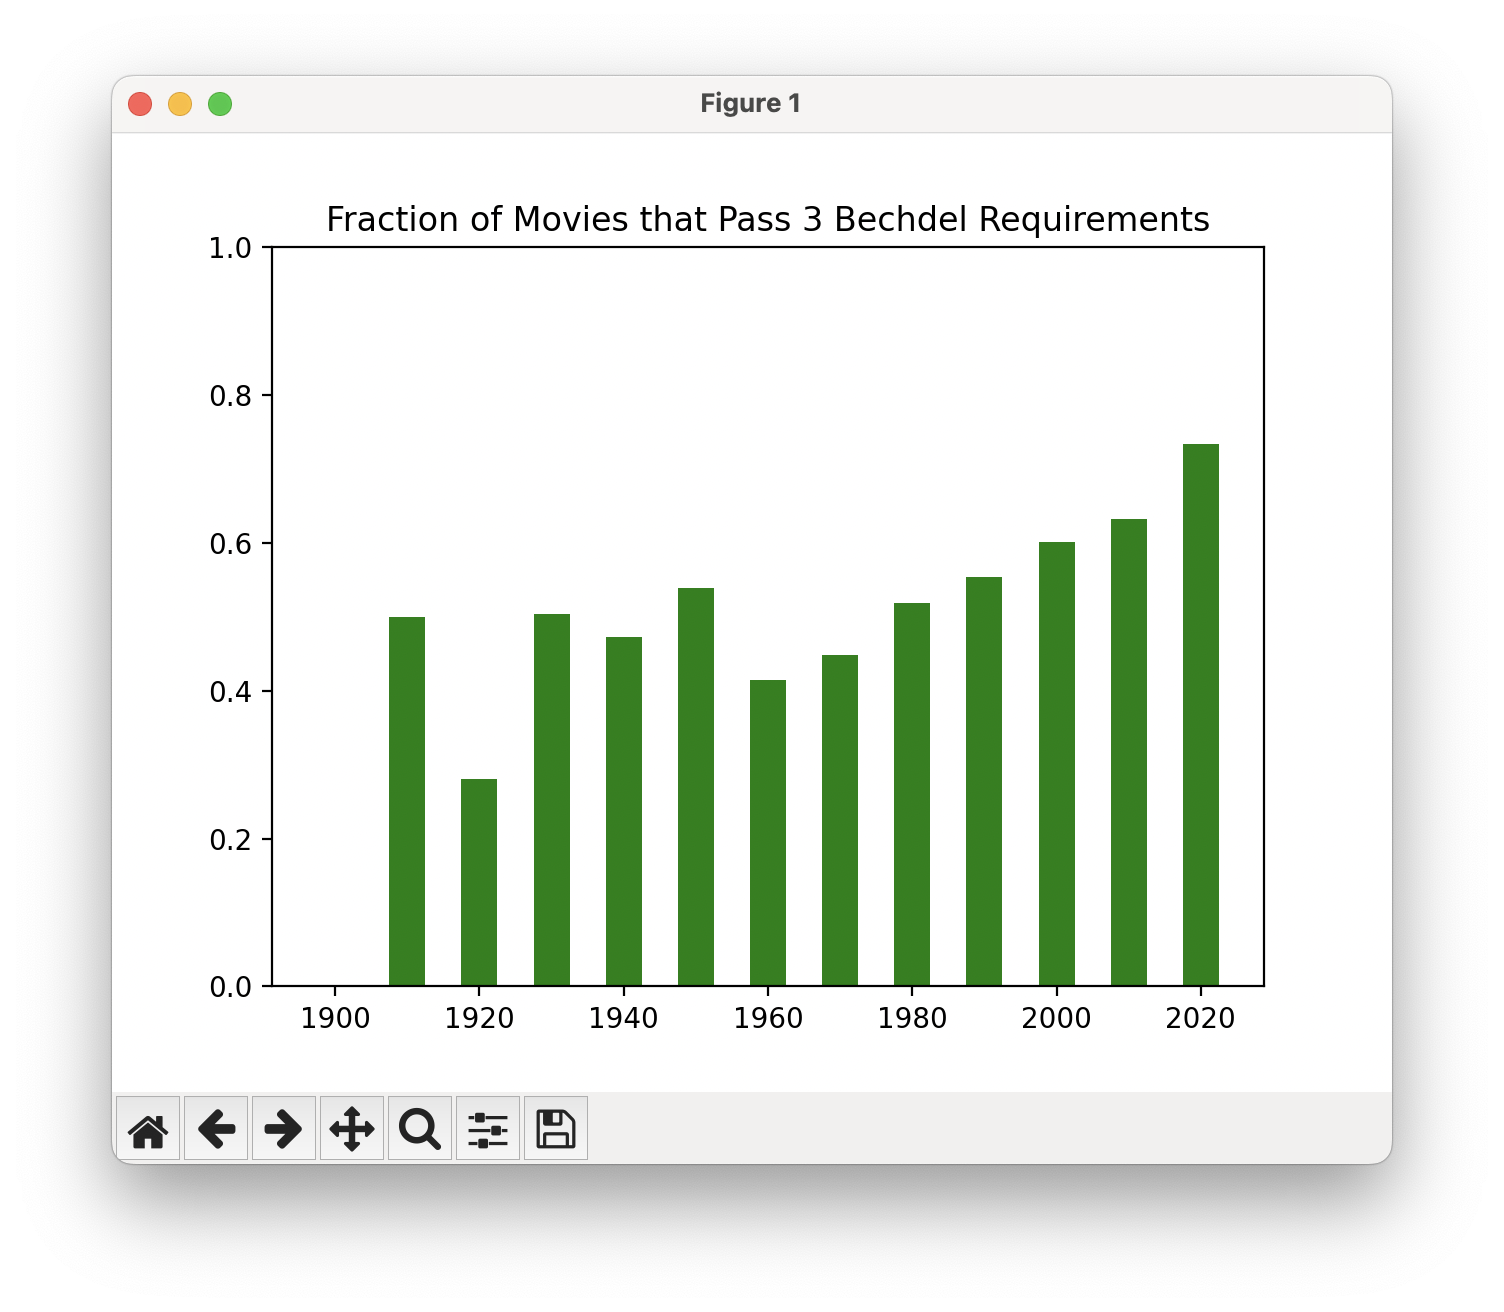
We want to create a bar plot of the fraction of movies that meet a certain number of the three Bechdel requirements across the decades, like the plot shown below:
We will do this using the matplotlib library. To make sure you have everything installed properly, download
the starter code at the top of this handout and open it in PyCharm as usual. If you haven't
installed matplotlib already, open the terminal in PyCharm and run the following command (if you have a Windows
computer, substitute py for python3): python3 -m pip install matplotlib
Recall that you can use matplotlib to make a bar graph by providing a list of x and y values, and a color like this:
x_vals = # some list of x values
y_vals = # some list of y values
plt.bar(x_vals, y_vals, color="green")
In the starter code, we have provided the call to plt.bar, and your job will be to create the
x_vals and y_vals lists. Take a look at the graph above; what are the x values (across
the bottom of the graph) and what are the y values (heights of each bar)? Use a list comprehension to create
y_vals.
Note that because the movies in our
input file were ordered chronologically, our dictionary's keys are already sorted in increasing order, so that
for our sample dict years above, we have:
>>> years
{1900: [1, 0, 0, 0], 1940: [0, 1, 1, 0], 2020: [0, 0, 0, 2]}
>>> years.keys()
dict_keys([1900, 1940, 2020])
>>> years.values()
dict_values([[1, 0, 0, 0], [0, 1, 1, 0], [0, 0, 0, 2]])
To test your function, type: python3 bechdel-graphs.py data-full.txt 3. You can change the 3 to
any number 0-3 to see the fraction of movies that passed 0-3 Bechdel requirements. For example: