Lab 8: Decoding ACARS
ACARS
This lab involves another digital packet radio system called ACARS, for Aircraft Communications Addressing and Reporting System. This sends short text messages between the ground control and aircraft, and can contain all sorts of different information.
The system operates in several different frequencies, including around 130 MHz, which is easy for you to acquire with your rtl-sdr's. In Gqrx these signals look like this
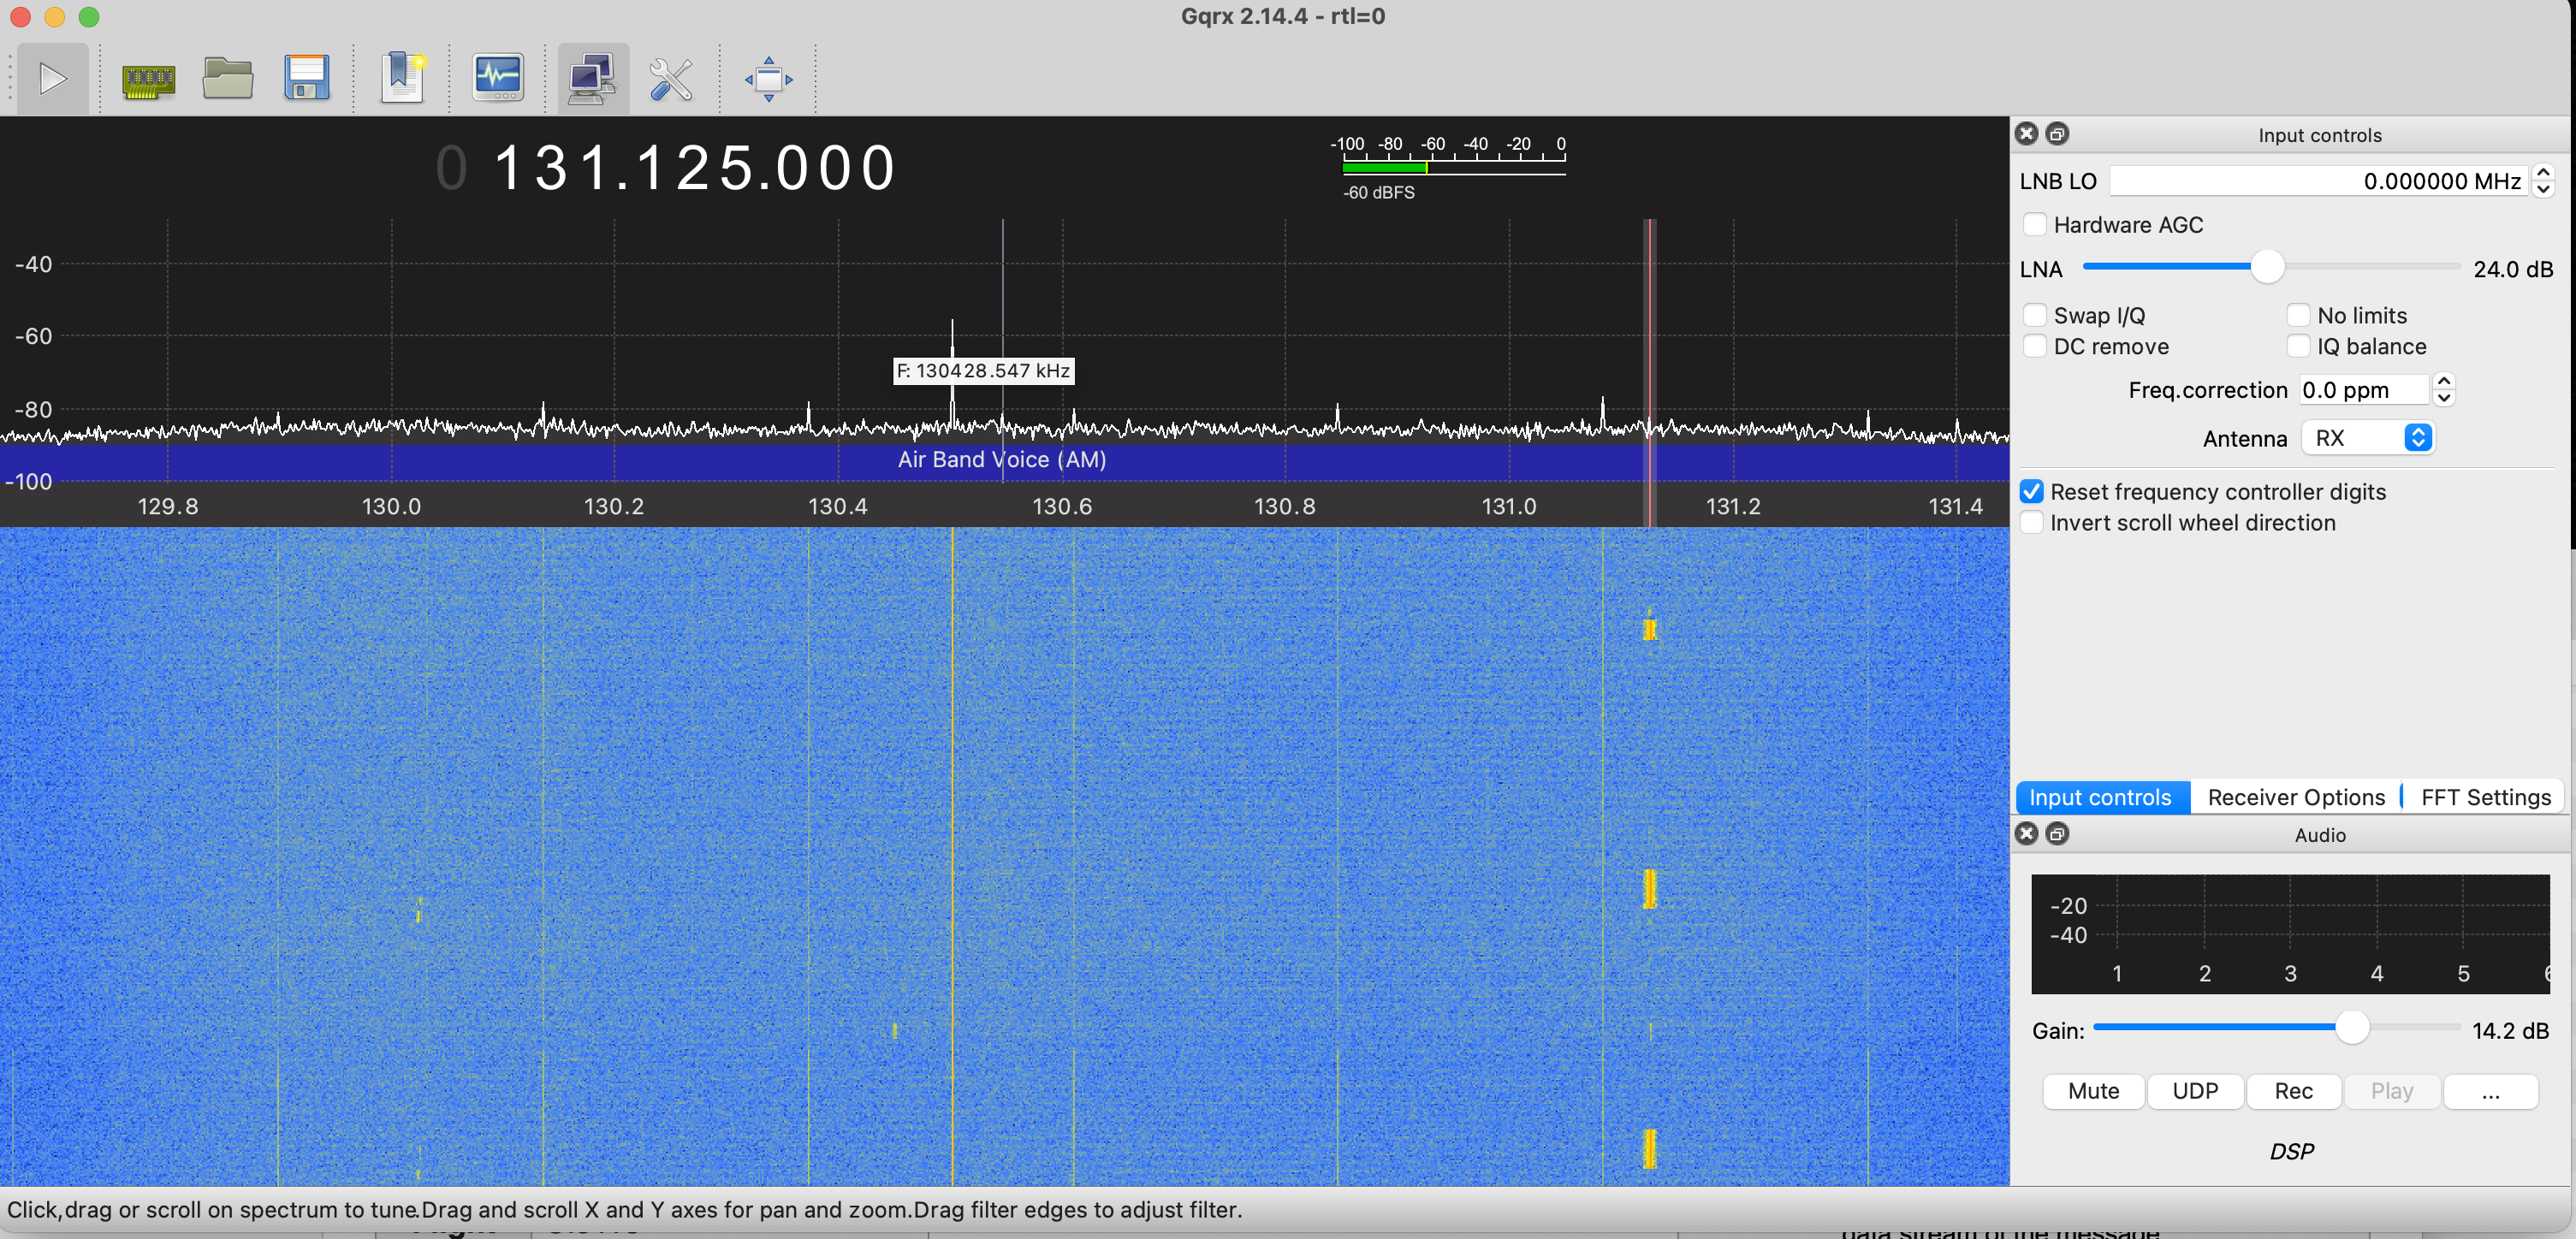
There are several ACARS frequencies. This plot shows the one at 131.125. This is a frequency that is mostly used by United for flight data. There is another at 130.075 which I also see frequently. One that has general traffic is 131.550 MHz, but I don't get as clean a signal from that one. The rtl-sdr can capture the whole band at once.
A data file with 80 seconds of data is available here
This has several high SNR packets to look at. The data was origianlly acquired at 1.2 MHz centered exactly on 131.125 MHz, and then decimated down to 120 kHz. This is a convenient sampling rate for processing
ACARS Packet Encoding: Minimum Shift Keying
The signals are amplitude modulated with a carrier present, just like the AM airband audio communications we looked at earlier in the course. This means we can use an envelope detector to extract the signal.
Binary data is encoded using FSK with frequencies of 1200 Hz and 2400 Hz. This signal uses Minimum Shift Keying (MSK) which uses the minimum duration orthogonal signals, as we talked about in class. This is 1/2 cycle at 1200 Hz, and one cycle at 2400 Hz. These are short enough that we have to be careful in decoding.
The data we have is sampled at 120 kHz. This is faster than we need, but this makes it easier to see what we are doing.
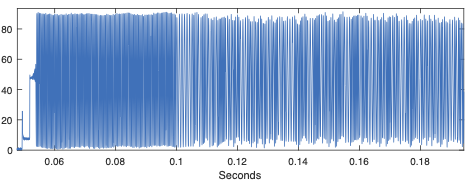
We can extract the ACARS signal simply by taking the magnitude (envelope detect). The results is
The packets themselves just contain a string of text, and can be of variable length. If we look at the spectrogram of the first part we see
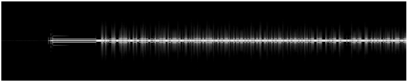
which doesn't show too much. Zooming in on the first packet we see
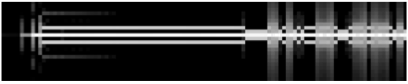
which shows that there is a preamble with a single tone, a synchronization interval after that, followed by the message. The bits are too short to be well resolved on the spectrogram. The AM carrier is present throughout the packet.
The single tone is to allow the receiver to synchronize with the frequency of the packet. The transmitter and receiver frequency sources may differ, and the moving plane will cause doppler shifts. We actually don't care about this since we did an envelope detection, but we could get a little better performance with a quadrature receiver and a phased locked loop to extract only the real component.
The next interval is to synchronize the timing of the packet, so that we can properly identify the data bits. More on this later.
The data bits are encoded using two differrent frequencies.
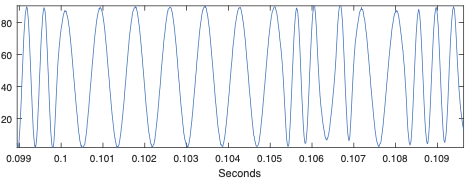
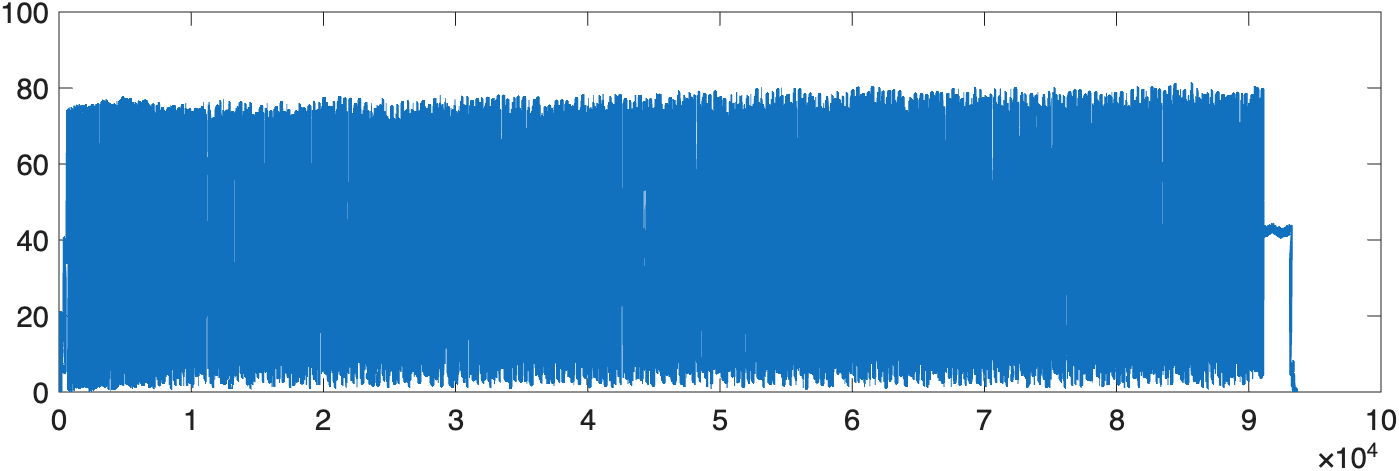
If we plot the first packet we see

We can see the AM carrier start and stop before the packet is transmitted. To see more, we zoom on on first part
The preamble and synchronization are obvious, followed by the packet data.
The modulation scheme used here is Minimum Shift Keying, or MSK. The two symbols that are uses are
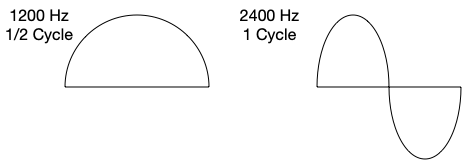
A zero is sent as 1/2 cycle at 1200 Hz, and a 1 is sent as 1 cycle at 2400 Hz. These are both sines, so that we can piece them together without discontinuities. Then to further smooth the response, we can send either the symbol or its negative. Both polarities decode to the same value. This looks like
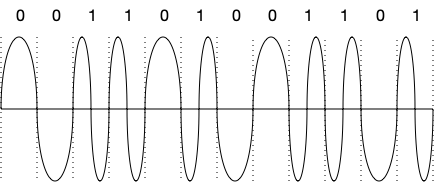
We will have to keep this in mind. If we really zoom in on the packet above, you can see the symbols with both polarities.
This gives you and idea of how the signal is put together. Next we go through in detail about how to decode it.
Finding the ACARS Packets
The signal can have a large number of packets in it. We want to be able to isolate each one and decode it. Fortunately the packets are encoded with conventional AM with a bias, which is the carrier. If we lowpass filter we can suppress the data, and leave us with the carrier.
>> load ac4.mat
>> %
>> % envelope detect
>> %
>> d = abs(d);
>> %
>> % fs is 120 kHz, included in ac4.mat
>> % ACARS symbol rate is 2400 Hz
>> % sw is the width of a symbol in samples
>> %
>> sw = round(fs/2400);
>> %
>> % use a Hamming window lowpass that is 20 symbols wide,
>> %    plus 1 to make it odd, normalized to 1
>> %
>> hlp = hamming(sw*20+1);
>> hlp = hlp/sum(hlp);
>> %
>> % Estimate the baseline (carrier)
>> %
>> db = conv(d,hlp,'same');
>>
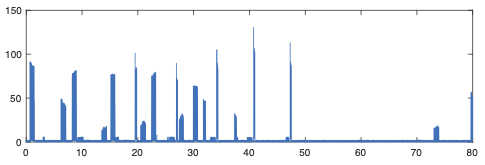
If we plot the result, it looks like
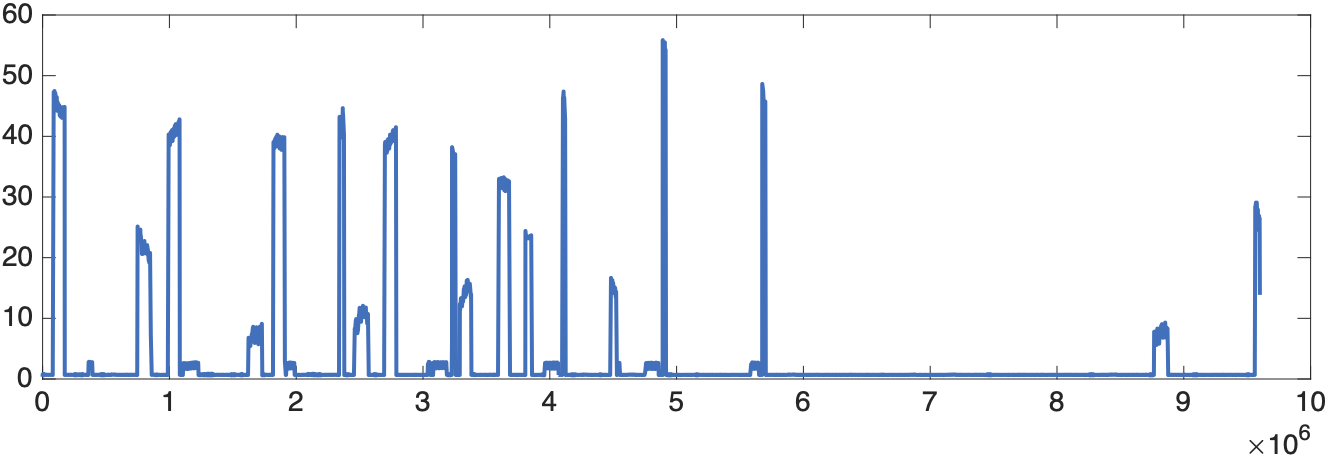
This is half the amplitude of the plat at the top, and clearly shows where the packets are.
To find the start and stop times, we need a threshold. We will choose a quiet interval at the beginning, compute the standard deviation, and set the threshold as a multiple of that. Here we choose a multiple of 4, which means it is very unlikely to be just noise
>> %
>> % set the packet threshold to 4 times the standard devaition
>> %
>> pth = 4 * sqrt(db(1001:2000)'*db(1001:2000)/1000);
>> %
>> %
>> pind = db > pth;
pind is is a binary waveform. If we plot pth*pind along with the baseline db we get
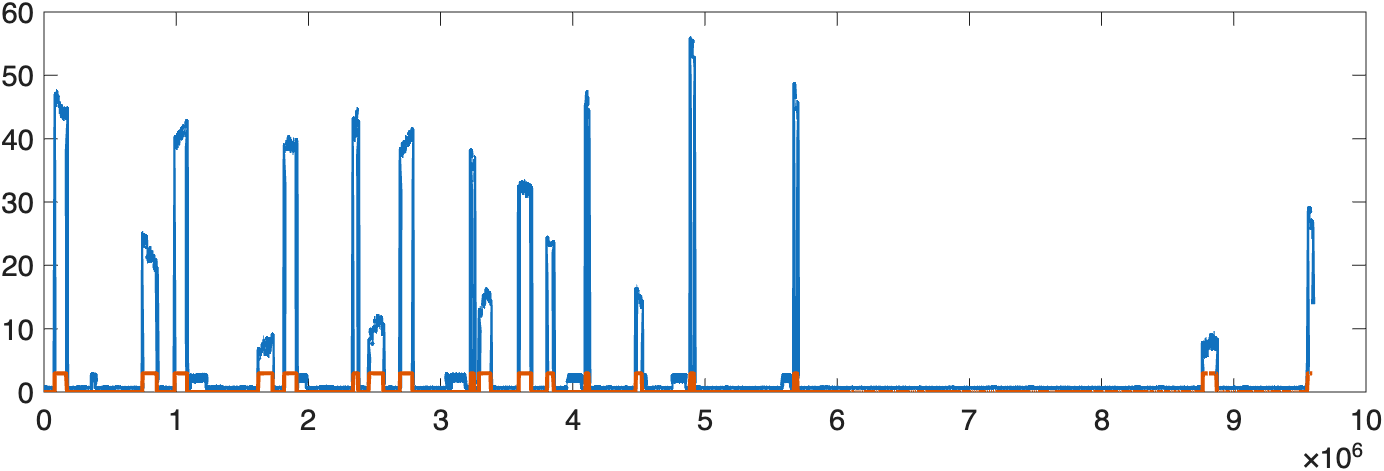
We've clearly identified the high SNR packets, and while excluding the very low ones we would have trouble decoding. Then we want to find the start and stop points of each packet. We can do this by differentiating the binary waveform, and looking for 1's for the start of packets, and -1's for the ends.
>> pindd = diff(pind);
>> pstart = find(pindd == 1);
>> pstop = find(pindd == -1);
>> np = min(length(pstart),length(pstop));
>> pndx = [pstop(1:np)](pstart(1:np));
pndx is now a list of start and stop times for each packet. For example, to plot packet 3,
which should give you
 We also know how many packet candidates we have. Again, we should take care of the case where a packet overlaps the beginning of the data. It does handle the case where a packet overlaps the end.
Finding the Data Bits in the ACARS Packet
Now we have access to the individual packets. Next we will find where the data bits start.
From above, the packet starts with an unknown number of 2400 Hz symbols (full sines). This part is intended for adjusting the frequency of the receiver.
The next part of the packet is 13 of the 1200 Hz symbols (half sines). The data symbols start immediately after this. We'll look for these in a very similar way to finding the preamble for the ADSB packets from last week.
We'll make a version of the sync waveform
>> %
>> % 13 symbols at 1200 Hz
>> %
>> nsync = 13;
>> %
>> % time for the sync waveform
>> %
>> tsync = <0:sw*nsync-1>/sw;
>> %
>> % Sync waveform
>> %
>> ssync = sin(2**pi**tsync**0.5)/(sw**nsync);
To look for it in the packet we first subtract off the baseline from above, since we don't need it any more, and it makes it easier to find the symbols. Then we take the first packet
>> %
>> % Subtract off baseline we found above
>> %
>> dp = d - db;
>> %
>> %  extract one packet, here packet 1
>> %
>> p1 = dp(pndx(1:1):pndx(1,2))
We use convolution to do the cross correlation since ssync is symmetric, and matlab's conv is better behaved than xcorr. We look for the sample where the cross correlation is maximum to identify the end of the sync segment
>> %
>> %
>> %
>> p1x = conv(ssync,p1);
>> %
>> % find the location of the maximum, this is END of the sync
>> %
>> [n1](m1) = max(abs(p1x));
Note that we didn't use the 'same' option for convolution. This means that the maximum will be at the end of the sync, and the start of the data bits. If we used 'same', it would be in the middle, which we will want below when we are decoding the bits. If we plot the first 20 symbols we get
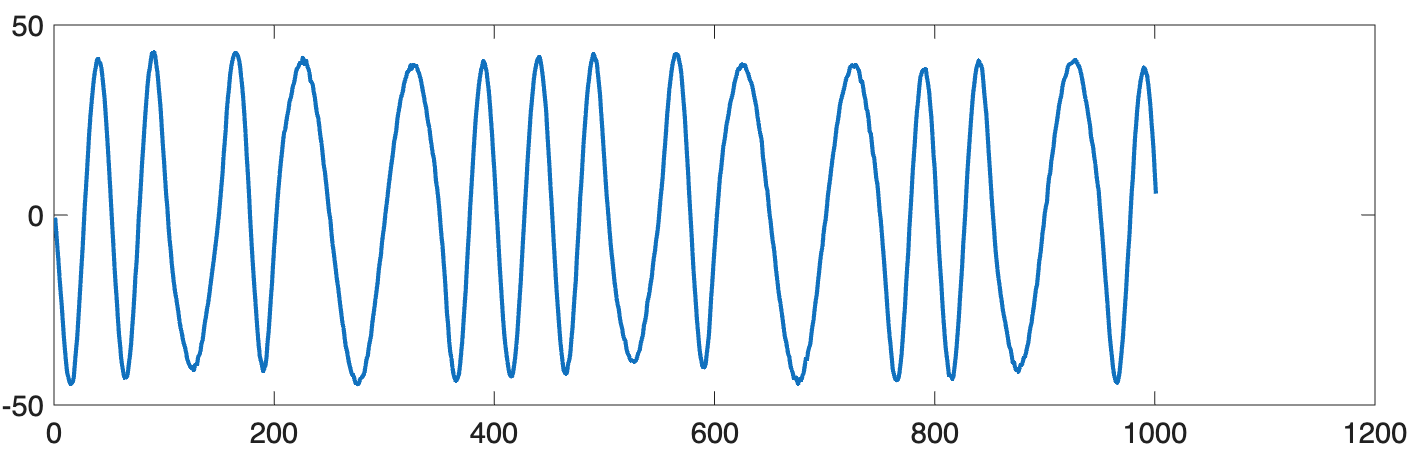
We see two 2400 Hz symbols followed by a 1200 Hz symbol, and onwards.
Decoding the Data Bits
We first need to detect the bits from the waveform, and then decode the line coding in the next part.
A simple way to detect the bits is to just sample at the middle of each symbol, the 1200 Hz symbol is 1, and the 2400 Hz symbol is 0. That would work, but we can do better.
We're going to use matched filters for each symbol. We'll filter the waveform with each, and then choose which is the largest.
For now we'll assume that the timing is perfect (it isn't!) but at least we can decode the first part of the packet.
We first design the two matched filters, and then cross correlate (actually convolve, as above) to identify the symbols.
>> %
>> % time for one symbol
>> %
>> ts = [0:sw-1]/sw;
>> %
>> % the symbol waveforms
>> %
>> s0 = sin(2*pi*ts*0.5)/sw;
>> s1 = sin(2*pi*ts*1.0)/sw;
>> %
>> % Compute cross correlations using conv
>> %
>> p10 = conv(p1,s0,'same');
>> p11 = conv(p1,s1,'same');
If we plot the first 20 symbols of the original waveform, along with the two matched filtered waveforms we get
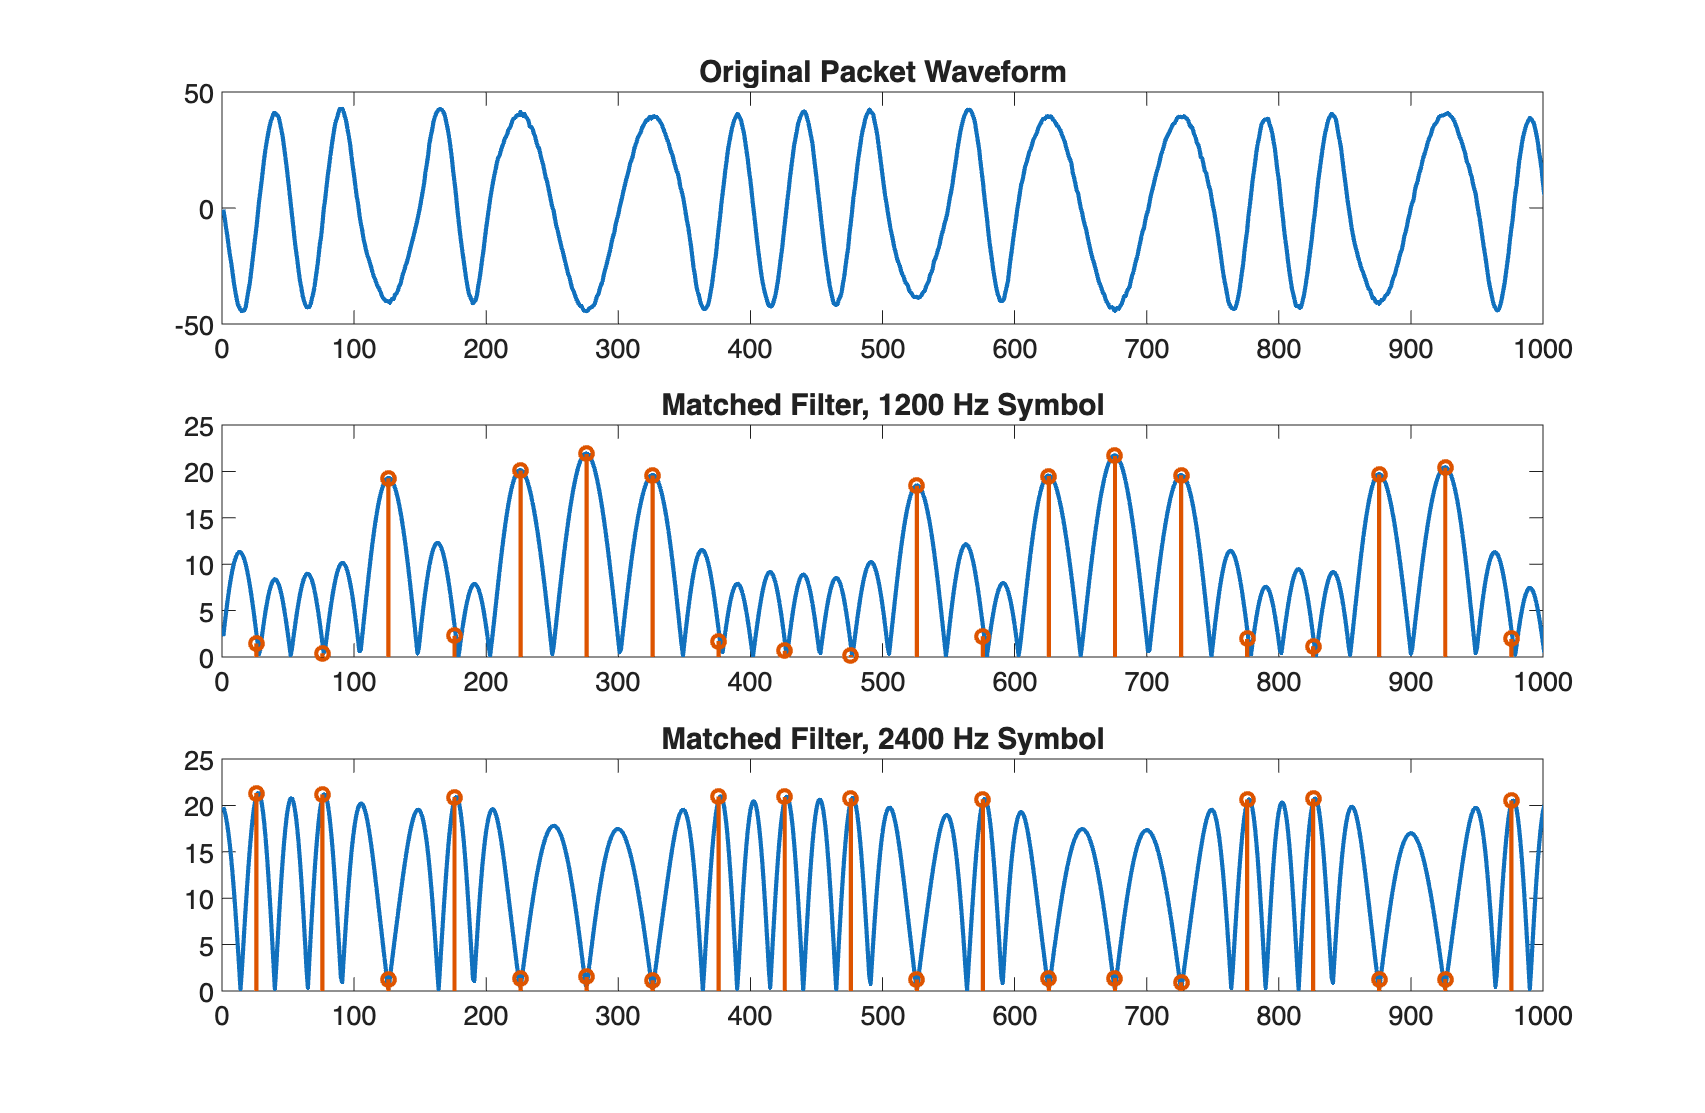 The stem plots show where the middle of the symbols are, which is where we want to sample.
The data bits are decided by choosing which of the two matched filters produced a larger signal at the center of the symbol.
The stem plots show where the middle of the symbols are, which is where we want to sample.
The data bits are decided by choosing which of the two matched filters produced a larger signal at the center of the symbol.
>> %
>> % sample at the middle of each symbol
>> %
>> swh = sw/2;
>> %
>> % Compare absolute values, since the MSK symbols could have either polarity
>> %
>> p1b = abs(p10(n1+swh:sw:end)) < abs(p11(n1+swh:sw:end));
>>
>> stem(p1b(1:20));
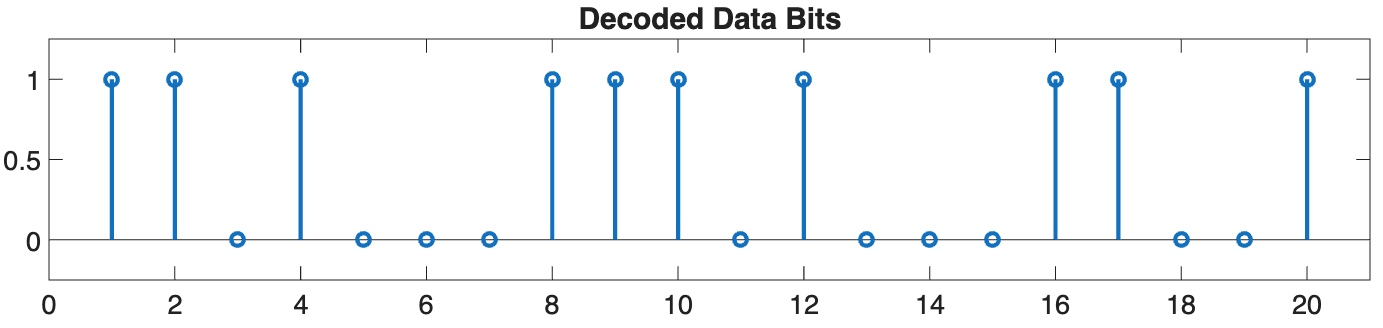
This looks just like you'd expect given the previous plots!
Decoding the Line Coding
Now that we have the sequence of data bits, we can undo the line coding. ACARS uses a non-return to zero inverted (NRZI) encoding, which takes some care.
NRZI encoding uses a 2400 Hz symbol indicates that this bit is the same as the previous one, and 1200 Hz symbol to indicate that the bit has flipped. We start at one, and work through the waveform one bit at a time.
The packet decoding assumes that the the sync portion of the preamble along with two previous 2400 Hz symbols are included before the data packet.
Hence, the sync symbols serve for timing, and are also part of the packet data.
The decoding proceeds by starting with the initial 1, and then examining each next data bit to see if we stay the same (the data bit was 1) or we invert from the previous bit (the data bit was zero). We can do this with
>> %
>> % start out at 1
>> %
>> b = [1];
>> %
>> % for each next bit, check to see if we need to flip
>> %
>> for jj = 2:length(p1b)
>>    if p1b(jj) == 1
>>        b = [b b(jj-1)];
>>    else
>>        b = [b ~b(jj-1)];
>>    end
>> end
The resulting first few bits are
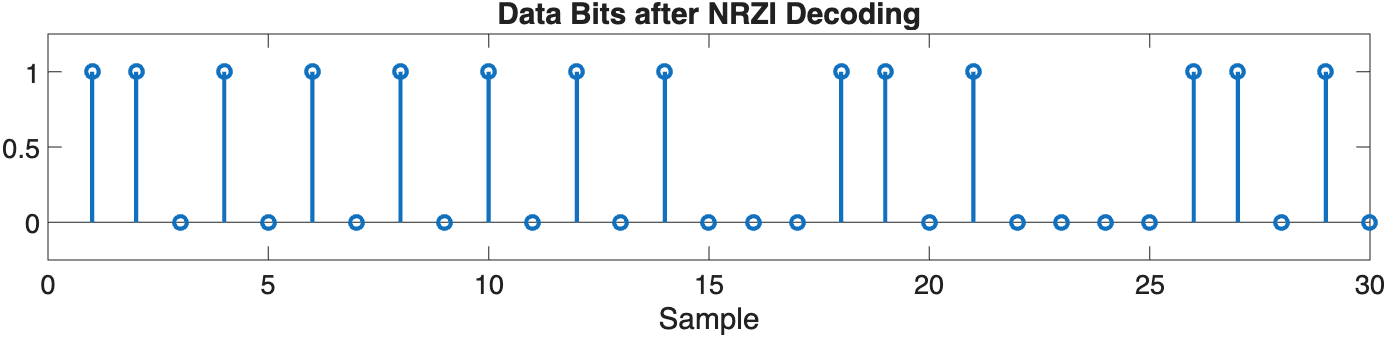
This decoding is a little unusual, since it depends on the previous output. I'm not sure why they did this, since it causes the process to have memory, as you will see below. Differential coding would have been easier.
Parsing the Character Data
The packet is just an array of bytes that are encoded as 7-bit ASCII characters with an added 8th parity bit. The bytes are sent in little-endian order. The parity bit is odd, contrary to many web sources.
There are quite a few standard fields, including several that are the same in every packet. This will help you find the beginning of the actual packet data, and help you debug your decoder. These are all described here
Decoding ACARS from All Things SDR
This is a really useful webpage, it tells you what all the different fields in the packet are, what the different types of packets are, and also what the 7-bit ASCII codes are in bianry and hex.
The first bytes after the preamble are
1 1 0 1 0 1 0 1    '+'   Character
0 1 0 1 0 1 0 0    '*'   Character
0 1 1 0 1 0 0 0   <Syn>  bit sync
0 1 1 0 1 0 0 0   <Syn>  bit sinc
1 0 0 0 0 0 0 0   <SOH>  start of header
The bits are in the order they are in the packet, leftmost first. These are the same for every packet. Note that the first two bits of the '+' are 1, which comes from the preamble.
Check that this sequence of bits is what we decoded above!
The web page describes additional fields. For now we'll focus on the aircraft registration number, flight number, and whatever is included in the text field. Some of the packets don't have a text field, and are less interesting. Look the aircraft ID and Flight up on the web. The packet we were looking at above is from a Boeing 737 flying for United.
To help you display your packet, reshape the bit stream into an 8xN array, where N is the number of bytes. We first find nc, the number of bytes we have data for, and then format it
Then call
function db = decode_bytes(b)

%
%  b  is an 8 x N array of ones and zeros
%  db is the 7 bit integer for each set of bits
%
%  print the entire string with
%     sprintf('%c',db);

[n m] = size(b);

db = []

for jj=1:m
    cb = b(:,jj);
    cbs = sprintf('%d%d%d%d%d%d%d%d',cb);
    cbv = cb(1)+cb(2)*2+cb(3)*4+cb(4)*8+cb(5)*16+cb(6)*32+cb(7)*64;
    display(sprintf('%3d %s %x %c',jj, cbs, cbv, cbv))
    db = [db cbv];
end
For the packet above, the first few bytes are
>> cc = decode_bytes(bc);
  1 11010101 2b +
  2 01010100 2a *
  3 01101000 16
  4 01101000 16
  5 10000000 1
  6 01001100 32 2
  7 01110101 2e .
  8 01110011 4e N
  9 00011100 38 8
 10 01001100 32 2
 11 00101100 34 4
 12 10101011 55 U
 13 10000011 41 A
This gives the index of the byte, the 8 bits, the hex code, and the ascii character. It returns an array with the ASCII codes, which you can print with
where we've truncated the packet after the first 50 characters or so, since it goes on for quite a bit longer. One of the fields in the flight number, which is UA2315. The webpage above will help you figure out how to identify the various fields and information in the packet.
To see the whole packet along with the labels for all the fields, use
which you call with
If you look at the code for this, you will see how many of the fields in the packet are defined.
Symbol Synchronization
At least the first part of the packet decodes cleanly! In general the symbol synchronization can drift. We need to track this, and correct for this.
The idea is that each symbol, whether 2400 HZ or 1200 Hz, ends at zero. Instead of just starting at the first symbol, and stepping by the symbol width, we should check to see if there is a zero at the end of the symbol.
Check a few samples on either side of where you expect the zero to be, and find where the smallest value is. Then adjust your counter by that many samples, and continue. Typically searching for plus or minus one or two samples is enough.
As part of the lab below, you will implement this, and plot an eye diagram to show the effect before and after correction.
Parity Check
The last bit for each byte is a parity bit. As part of your lab below, check to see if the parity of each byte is correct, and report it. Check to make sure it is within the packet, you will get parity errors if you run off the end.
Lab Report
So far we've outlined a basic algorithm that successfully decodes at least a few packets. There are many things we can do to make it better. For your lab you'll start with the process described above, and implement it as an m-file. Then you'll extend this to automatically compute the decision threshold, add parity checking and correction, and automatically synchronize to the varying packet timing drift. In the end you should be able to decode almost all of the packets in the data set.
There is another data set here
This has more packets to look at. This has packets that won't decode until you fix the synchronization in part 3 below.
1) ACARS Packet Decoding Function
Write an m-file that takes a packet waveform and decodes the ASCII data, based on the process outline above. It should reproduce the data from above. Try it on two other packets in the waveform to see if they decode. They may not, which is fine. We'll fix that next.
Make the sampling rate fs and the noise threshold (4 above) optional variables, so that you can change them later.
For your report
- Submit your listing
2) Decoding All of the Packets in a Waveform
We found the start and stop points for each packet in the data file. Write an m-file that finds and decodes all of the packets, and calls your routine from part 1 on each one.
For your report
- Submit your listing
3) Symbol Synchronization
The major reason that decoding fails is loss of synchronization with the symbols. When this happens, you will get decode errors and parity errors.
Instead of just incrementing by a sample width sw when decoding each symbol, add logic to look for the smallest value at the end of each symbol. Then adjust the counter to correct for any errors. Usually one or two samples is enough, since these adjustments accumulate over the packet. If it is too large, the tracker can get lost. Make the search range a variable you can set.
Include the ability to plot an eye diagram. You can do this by storing the symbol waveforms as you decode them.
For your report, choose a packet that you can now decode with synchronization, and
- Include a listing of your synchronization code (just the part you changed)
- Plot an eye diagram without synchronization
- Plot an eye diagram with synchronization. This should look much better!
- Make a plot of your correction over the length of the packet.
4) Parity bits and Error Detection
Each 8-bit byte has a seven bit ascii character and a parity bit. Check the parity of each byte to see if you detect any errors. Report which byte has an error.
The message ends with either an ETX (0x03) or ETB (0x17) character. Compute the parity up through that point. The next two bytes are the CRC code, which could have any parity.
It seems like NRZI introduces memory, and that a single bit error will propagate through the rest of the packet. Consider the case where there is a single bit error in the middle of a byte that contains seven ones and a zero, where the previous output was 0.
Using our NRZI decoder it should decode to all zeros without the error, and the parity bit should be 1.
Assume the bit error is in the third bit, and is a 0. That will flip it , and all of the subsequent bits.
- What happens to the parity?
- Does the error propagate to the next byte?
- Can I do anything to recover the rest of the packet?
- What happens if the error was in bit 4?
In either event, you'd get a CRC error at the end of the packet.
5) Sampling Rate
We have been sampling at a much higher rate than needed. The Nyquist rate is only 5 kHz! How much can you reduce your sampling rate and still decode the packets? Use the matlab resample() function to change the sampling rate to something lower. Choose rates where a symbol is an integer number of samples. The data we are using is sampled at 120 kHz, and symbols are 50 samples wide. To get to a sampling rate of 48 kHz, you would use
That would give you symbols that are 50*2/5 = 20 samples wide.
One consideration is your synchronization code. As the sampling rate drops, you may want to limit how many samples you want to search for the next symbol end zero. You made the a variable in part 3.
For your report
- What sampling rate still allows you to decode most (say 90%) of the packets you found at 120 kHz?
Conclusion
That's it! Just about everything from the course is here in this lab somewhere. These are the same techniques you'd use to figure out how to decode any other waveforms you capture in the wild. I hope you found this interesting. Let me know if you have any comments or suggestions.