Lab 1: Installing SDR receivers
Overview
The USB dongles we are giving to you can directly digitize a 3.2 MHz segment of the RF spectrum, from 27 MHz up to 1.7 GHz. This can capture a large part of the RF spectrum, which we can then process using public domain software, and extract the signals we want.
In this lab we will install the USB software for your computer, and then use a real time spectral display to look at some of the different signals that are all around you.
Aims of the Lab
This lab is aimed getting your software working, and starting to look around at all of the signals that you are constantly being bombarded with. Find an interesting frequency, and try to identify what is happening there. Next week there will be more to do.
Software Installation
There are two parts to the software you need. The first is the device driver to control the SDR. The second is the spectrum visualization software. For mac users, you can download all of this in one package. For windows users, you need to download the drivers and the visualization software as a package, and then install them separately.
MacOS
For MacOS, we will use the gqrx program. This is a graphical interface that is built on top of gnu radio, an open source software defined radio project. When you download gqrx, you will also get the gnu radio libraries.
The gqrx web page is
A little way down the page is the link for downloads.
The last two releases don't work on modern macs (2.17.6 and 2.17.7). These releases probably would work if you build them from source (homebrew or macports), but the versions here crash on startup.
Scroll down until you get to the 2.17.5 release. This still has the intel code, and runs just fine under Rosetta.
Choose the ".dmg" file. That is a disk image of the application for a mac. The "AppImage" is for linux.
Double click on the downloaded ".dmg" file, and the move the gqrx icon into your Applications folder.
Next, plug the SDR into your computer. You may need an adapter if your computer only has USB-C ports. I have a couple you can use.
Next, we'll start the program up. MacOS is now very careful about what apps you can run. First, find the "Security and Privacy" control panel in "Settings". Click the lock symbol, and type in your password to allow changes. Click on "Allow downloaded apps from the app store and identified developers". Then double click gqrx to try to run it. In the "Secururity and Privacy" panel it will warn you about gqrx. Click the "Open Anyway" button. Then click the "open button in the smaller pop-up window.
The description of this process is on the apple support page
You only have to do this once, gqrx will work like any other app from now on.
Windows
For Windows we will use SDR#. This is the same sort of program as gqrx, but written in C# for Windows. The web page is
SDR# used to be an amateur project that was taken over by Airspy, which makes very nice higher-end SDR's. Download the first package, that includes SDR# along with a number of other interesting and useful components. You also need to install drivers for windows, which is described here:
Note the part about manually downloading Zadig.exe. Once I did this, it worked for me pretty directly. I wish you luck.
Make sure you follow the iinstructions about setting the RF gain to something more than zero. Otherwise you won't hear very much at all!
For linux (Ubuntu, Raspbian, etc), just do
in a terminal. Then go get some coffee. It will take a while.
An Alternative for MacOS, Linux, and Windows
An alternative that runs on all three platforms is sdr++, or sdrpp. You can download this at
This is pretty active, and is the basis for other interesting programs like satdump, which is great for listening to satelites.
Commercial FM Radio
First, plug the antenna into your sdr, and the sdr into a USB socket on your computer. Then, start your program. We'll look at gqrx here, but SDR# is very similar, and has the same settings to adjust.
When you start gqrx, it will pop up a window for the device configuration
Configuration Window
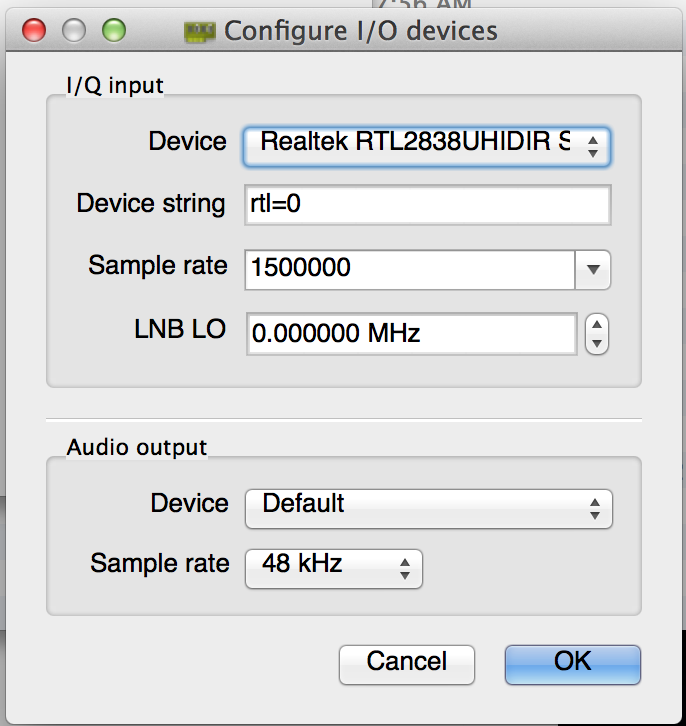
Set the sample rate to 2400000 (i.e. 2.4 MHz). Your computer and the sdr should keep up with this easily. After clicking OK, gqrx will pop up:
Initial Display
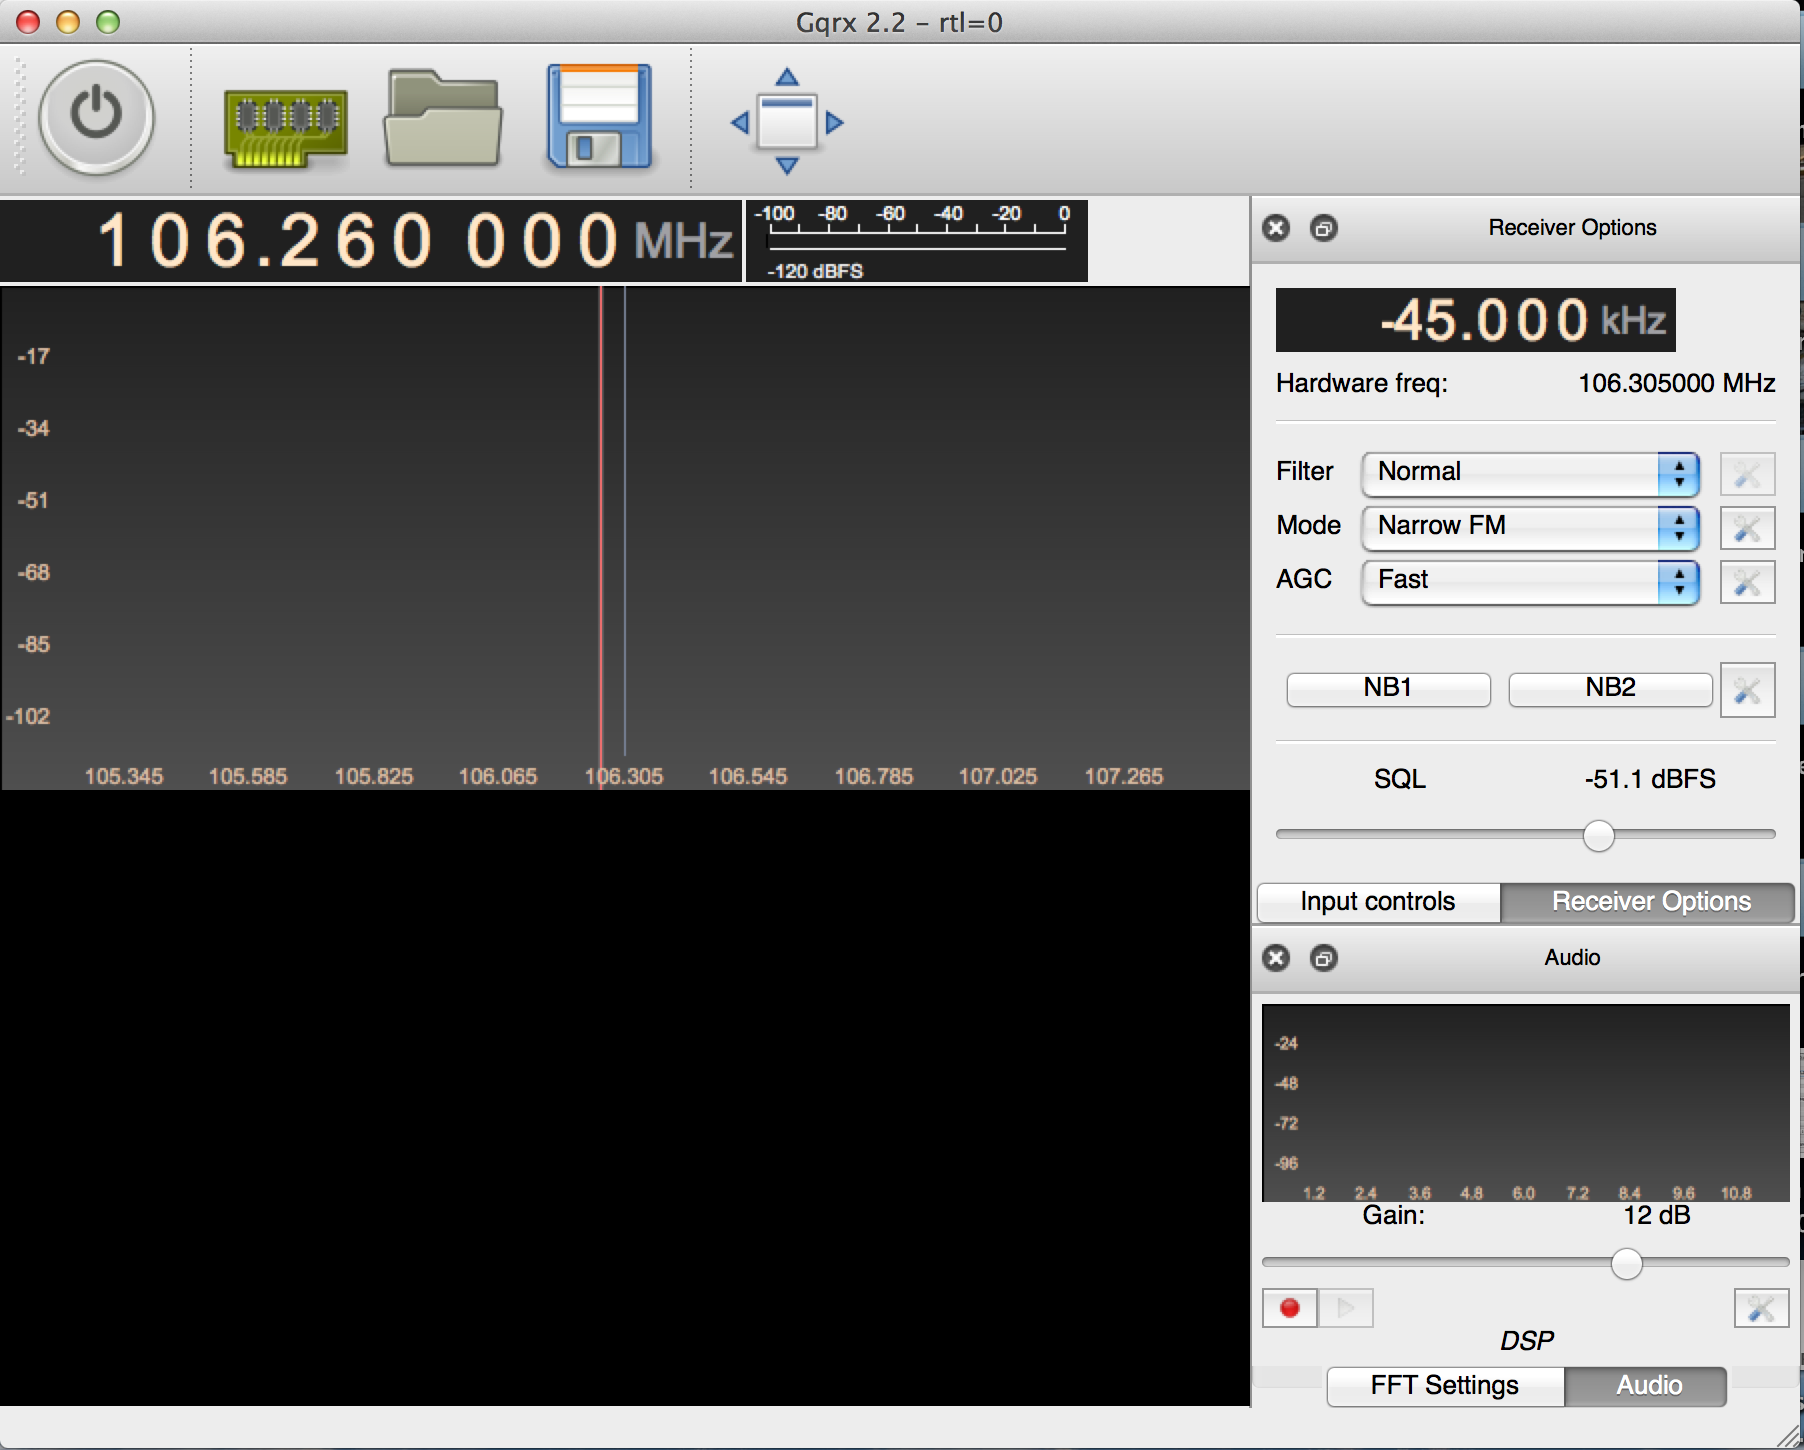
This is a previous version of gqrx, but it should look similar. Set the frequency offset in the upper right to 0.000 kHz, and then set the receiver frequency in the upper left to 88.500 000 MHz. If you are in the Bay Area, this is KQED, which is a nice clean signal.
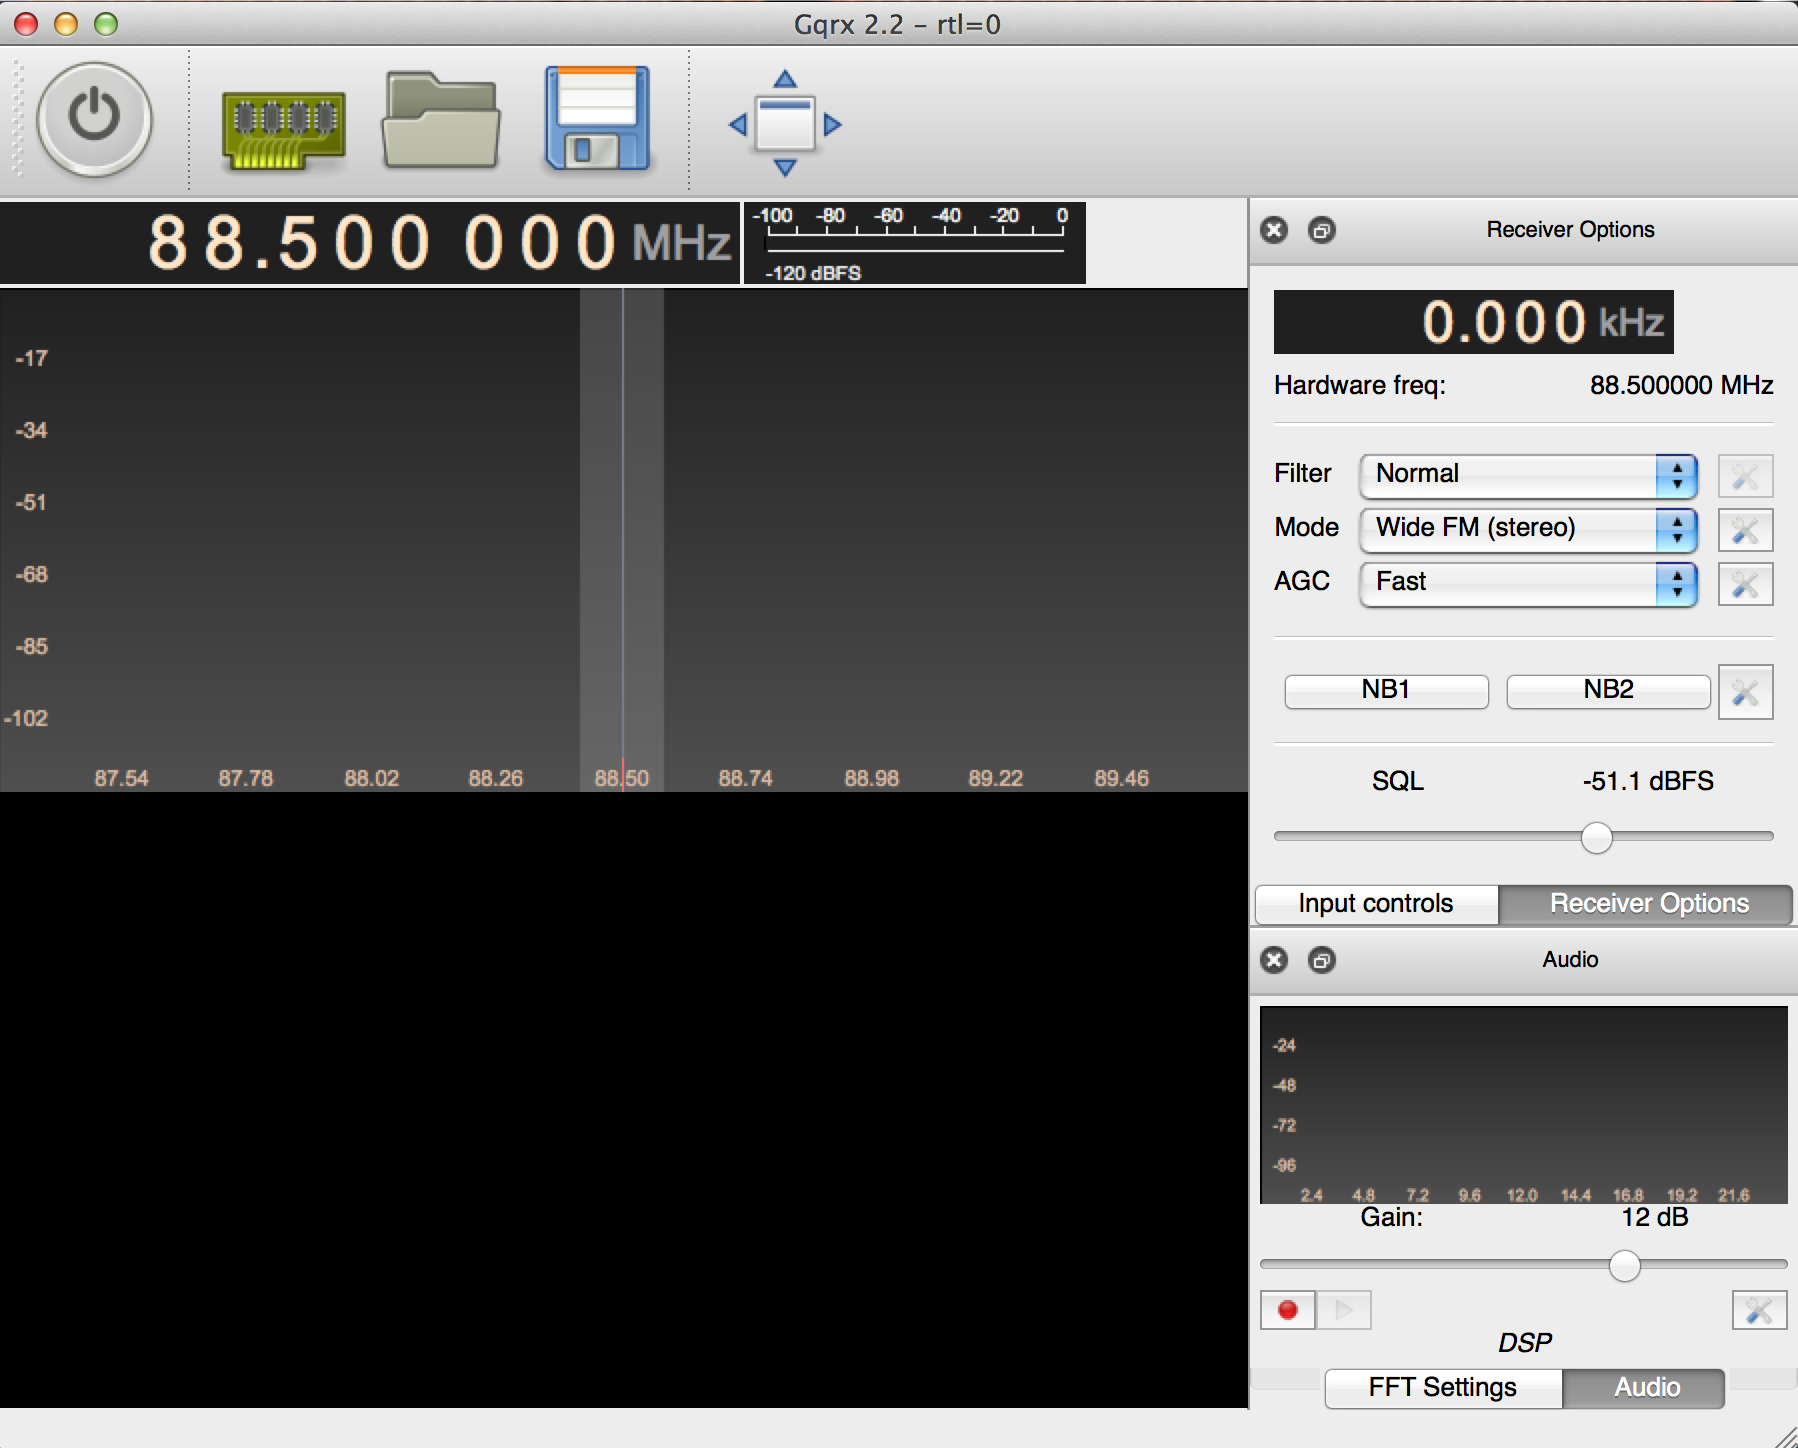
Change the "Mode" pulldown on the right side of the screen to "Wide FM (Stereo)". The display should look like this:
Tuned to KQED
Now click the big button in the upper left corner. It looks like an on/off power button. With any luck, you should be listening to KQED! If you are not in the Bay Area, there may not be a station at 88.5. Find the biggest signal on the display and clip on it in the upper window. That will tune in that station.
Tuned to KQED
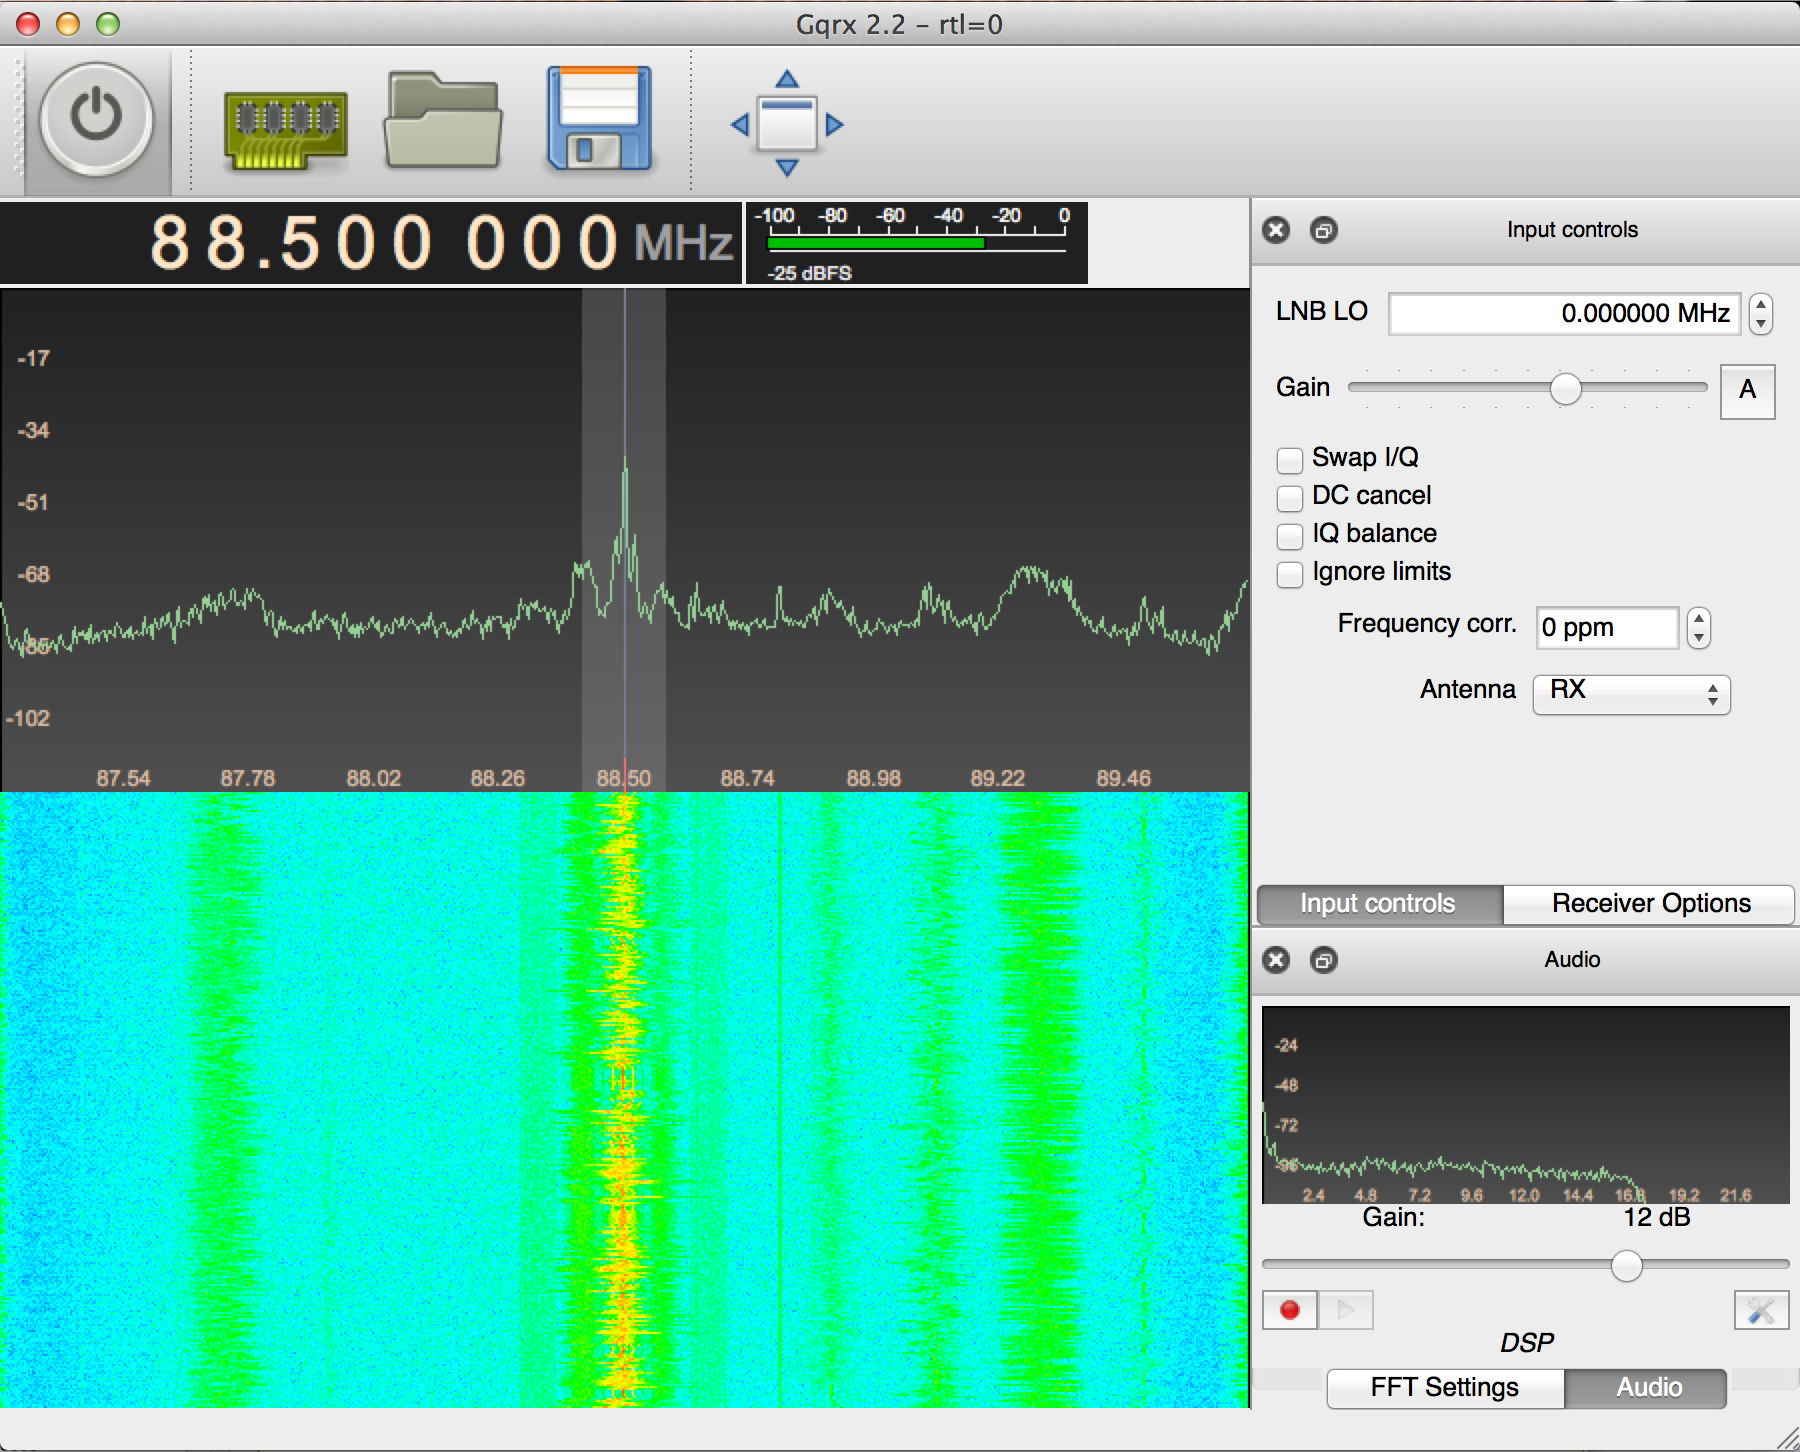
The plot in the upper panel is the live spectrum that is being received, and has a range +/- 1.2 MHz, since you set the sampling rate to 2.4 MHz.
The lower panel is a waterfall plot. Each line in the image is the spectrum from the top panel, displayed with color encoding amplitude. It slowly scrolls down as you acquire longer. This plot is a great way to recognize different types of signals.
One useful setting is the receiver gain. To change this click on "Input Controls", which will bring up a panel for controlling the SDR. The slider at the top adjusts the gain. If it is too low (to the left), the signal will be all noise. If it is too high (to the right) the receiver saturates, and the signal is distorted. The "A" button sets the gain automatically, which you generally don't want to do when you are looking for signals, since it will constantly be changing.
Go back to the "Receiver Options". The top "Filter" pulldown sets how wide a bandwidth we are listening to. This is the shaded region on the live spectrum plot. On "Normal" it chooses something reasonable for whatever modulation we are receiving, so generally leave it there. The middle "Mode" pulldown selects how the receiver decodes the signal. Common choice are "AM", used for aircraft and air traffic control, "Narrow FM" used for police and fire radio, and "Wide FM" used for commercial FM radio. We will talk about the other options later. The bottom "AGC" pulldown sets how rapidly the receiver adjusts for amplitude variations in the signal.
Try setting the center frequency to other stations that you know (such as 99.7, my daughter Rachel's favorite, or 105.3). Often you will see several stations in the plot, as shown below:
Tuned to 99.7
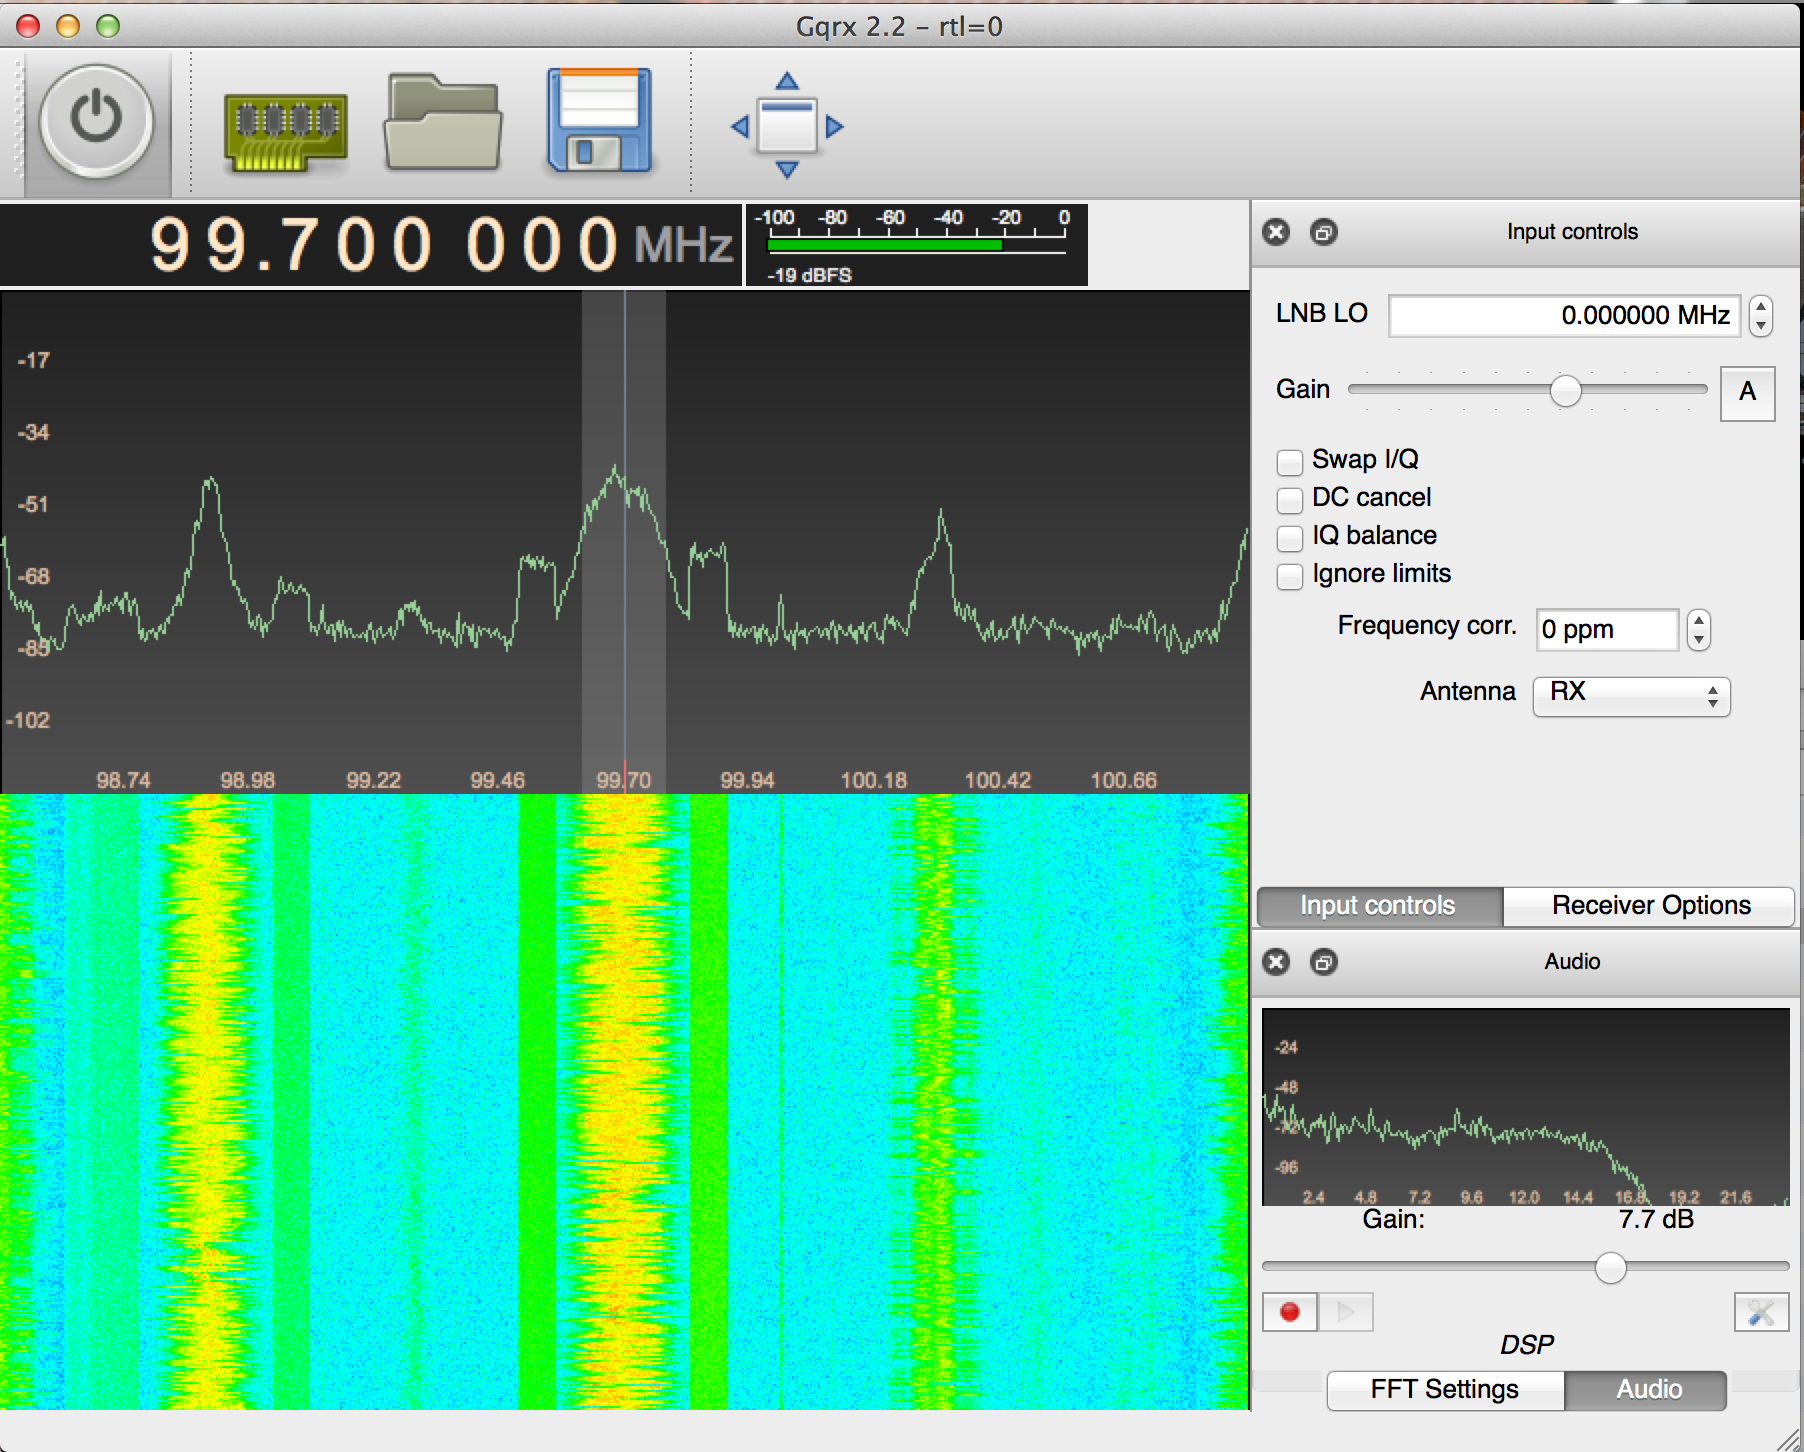
Select any of them by clicking on them in the top panel. That will set the receiver offset.
The SDR# version looks like this, when tuned to KQED:
SDR# Tuned to KQED
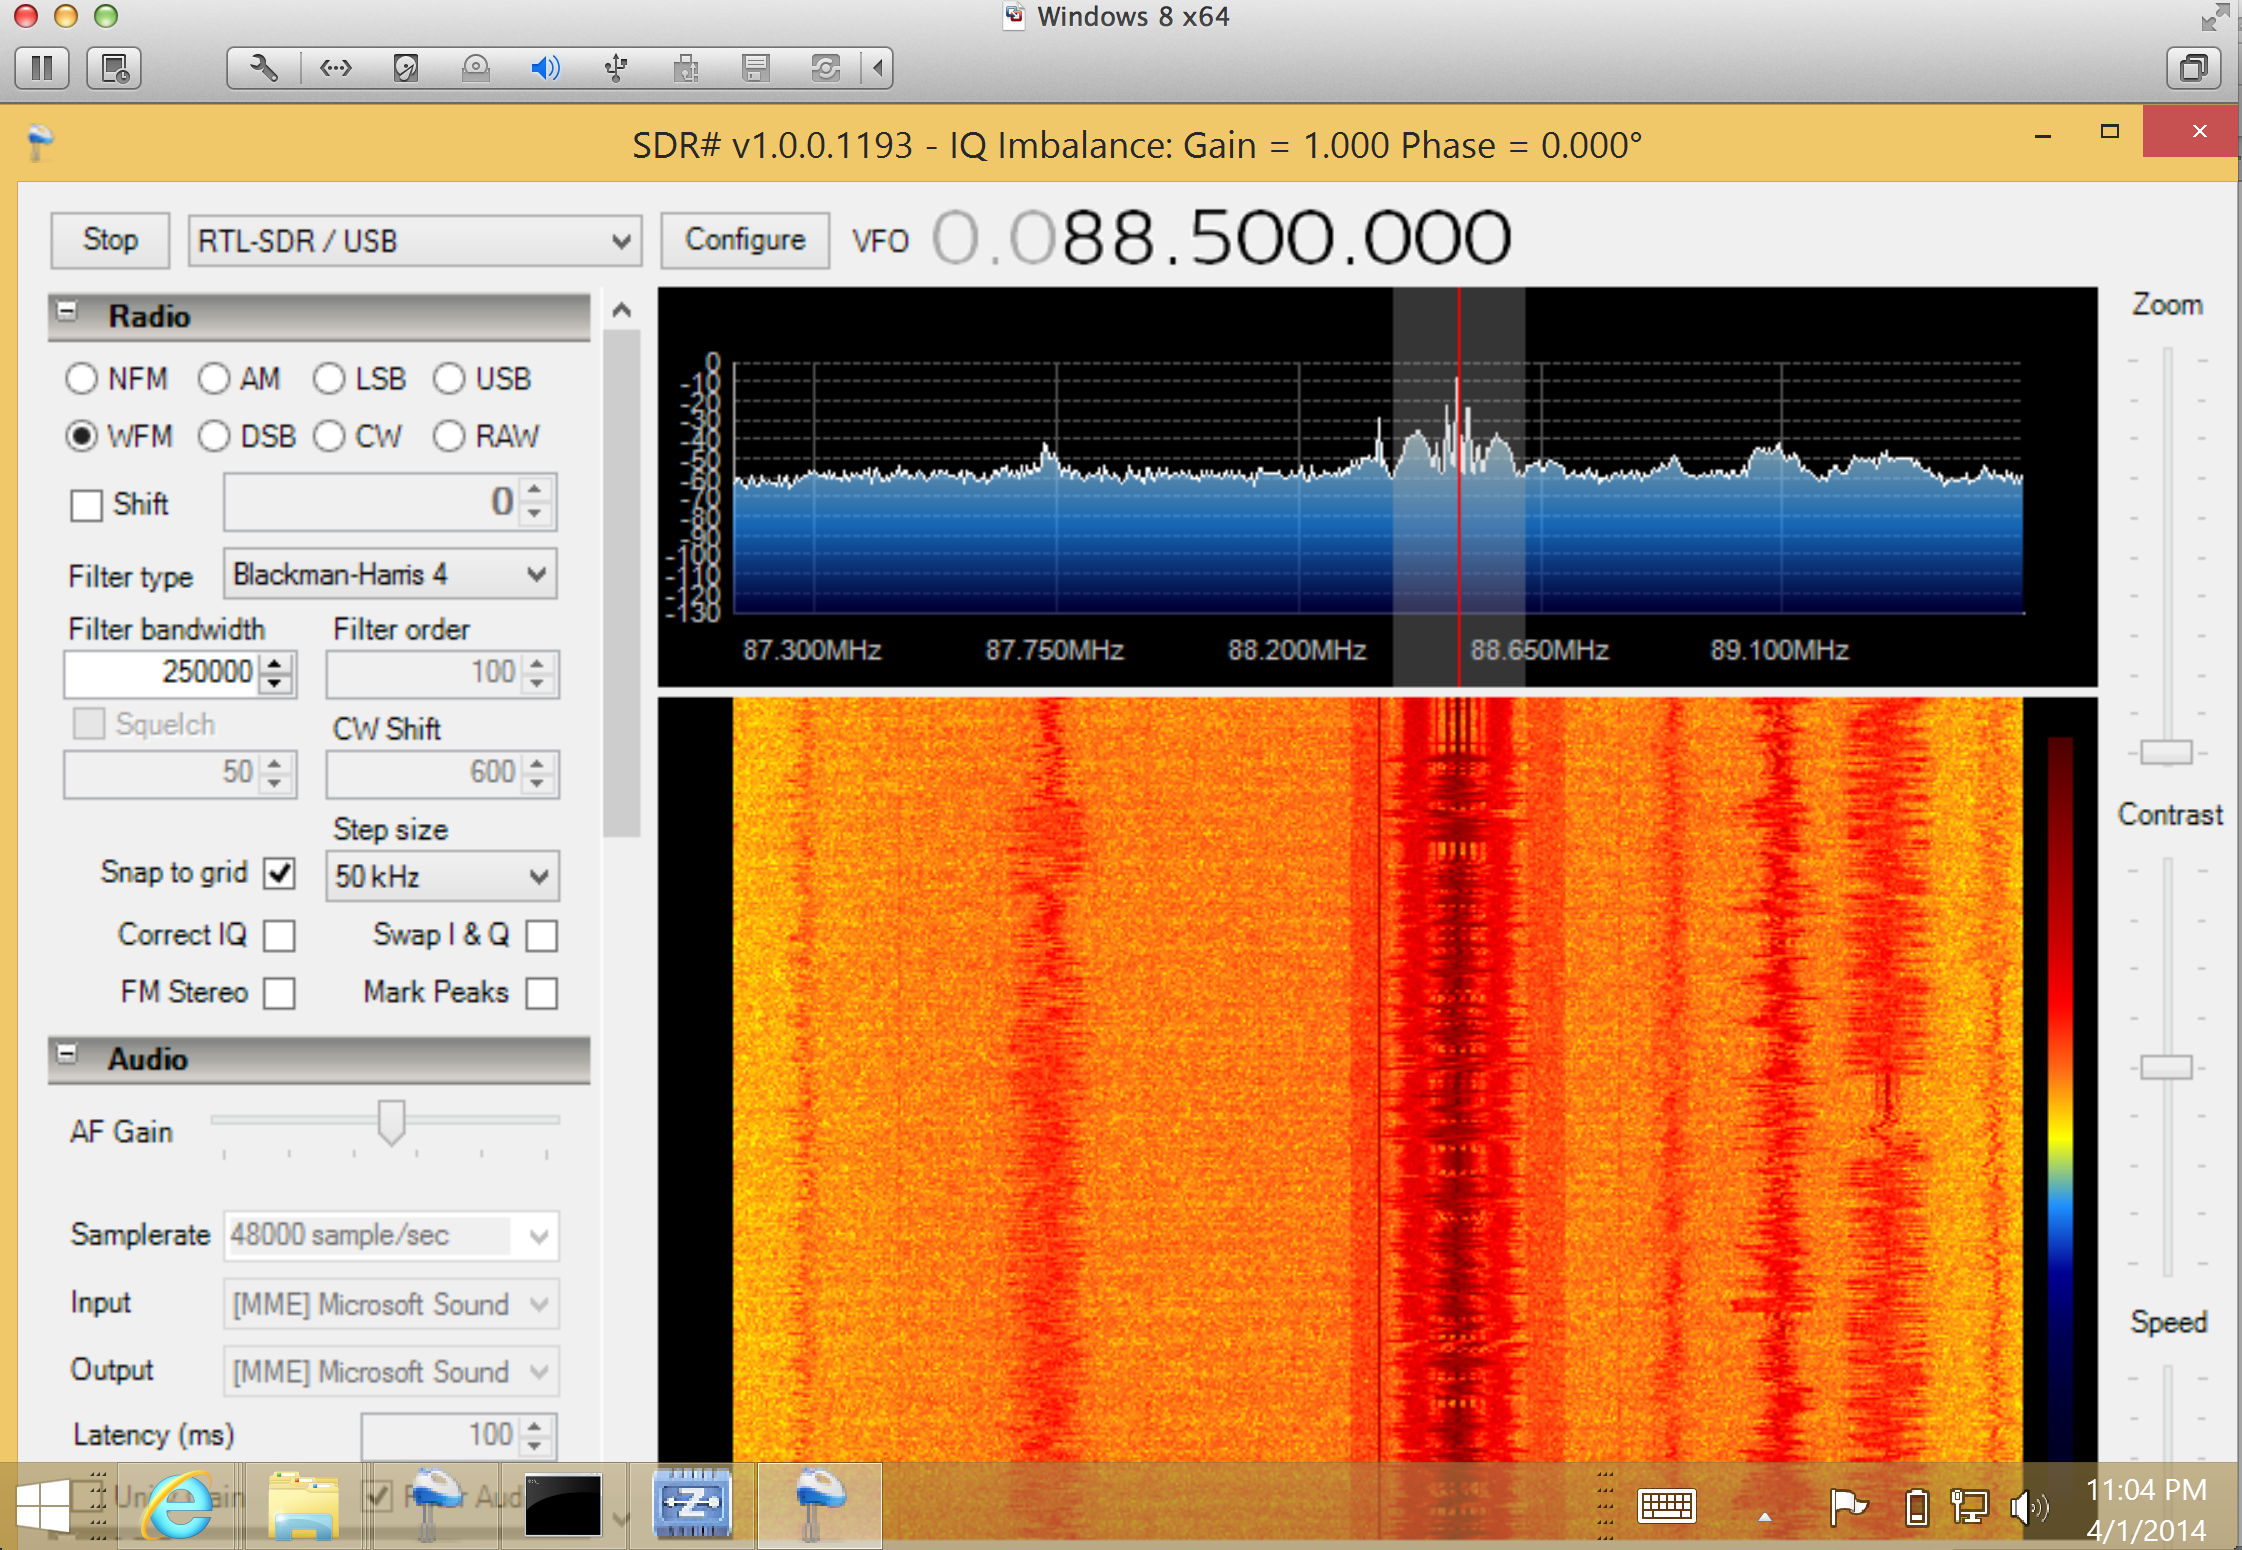
Choose "RTLSDR/USB" as the input, next to the stop/play button in the upper left. Aside from the color scale, one difference from gqrx is that the SDR gain and sampling rate is set by the "configure" button. Otherwise the controls are pretty much the same.
We will come back to commercial FM in a couple of labs.
Assignment
The assignment this week is to get your sdr set up and running, and find some signals. Tune to each of these signals, and capture a screenshot of the display. Set the decoder (the "mode" from the pulldown from above) as specified, and try to figure out what that signal is doing.
- 134-136 MHz with AM
- 144-146 MHz with narrow band FM
- 160-162 MHz with narrow band FM
- 461-463 MHz
- 929-930 MHz
The last two are digital so you won't be able to decode them. Use narrow band FM and describe what you hear. For the 144-148 MHz band, you'll have most luck on Monday to Wednesday evenings from 7-9 PM, and any morning from 9-11 AM. Note that both gqrx and SDR# label the name of the band you are receiving, along with the type of modulation (narrow FM, AM, etc). This is not always right! You can try the different built in decoders (AM, FM, WBFM) to see if they make sense. Use RadioRefenence.com, Google, or Chat GPT to look for who uses that frequency. Finally, there is a great web site: Signal ID Wiki That has examples of almost any signal you might find, along with waterfall plots and audio clips. Some of them are pretty interesting sounding.
Your Report
Make a document in your favorite word processing app. For each of the signals include:
- The frequency band
- The screen shot
- Your assessment of the signal
Turn your lab in with Gradescope. There is a template there you can use if you would like. Make sure to identify the answers for each signal to help the grader out.