
|
|
|
|
|


Summary Result
Figure 1 shows the model prediction against the flame speed target set for both trial and optimized models. The error bars represent 2-standard deviation. The optimized model shows improved agreement with the experimental data, and gives substantially reduced prediction uncertainty in all cases. For example, the trial model predicts the laminar flame speed targets with an average deviation of 11.5%, while the optimized model brings the deviation down to 6.7%. What is perhaps more significant is the greatly reduced model prediction uncertainty, as evidenced by the greatly reduced 2σ values of the optimized model. Before optimization, the model prediction uncertainty is comparable to the experiment, whereas after optimization the 2σ values of the model are reduced by a factor ranging from 2 to 15. A similar test for the shock-tube and flow reactor targets is shown in Figure 2. Again, the optimization procedure greatly reduced the model prediction uncertainty.
|
|
|

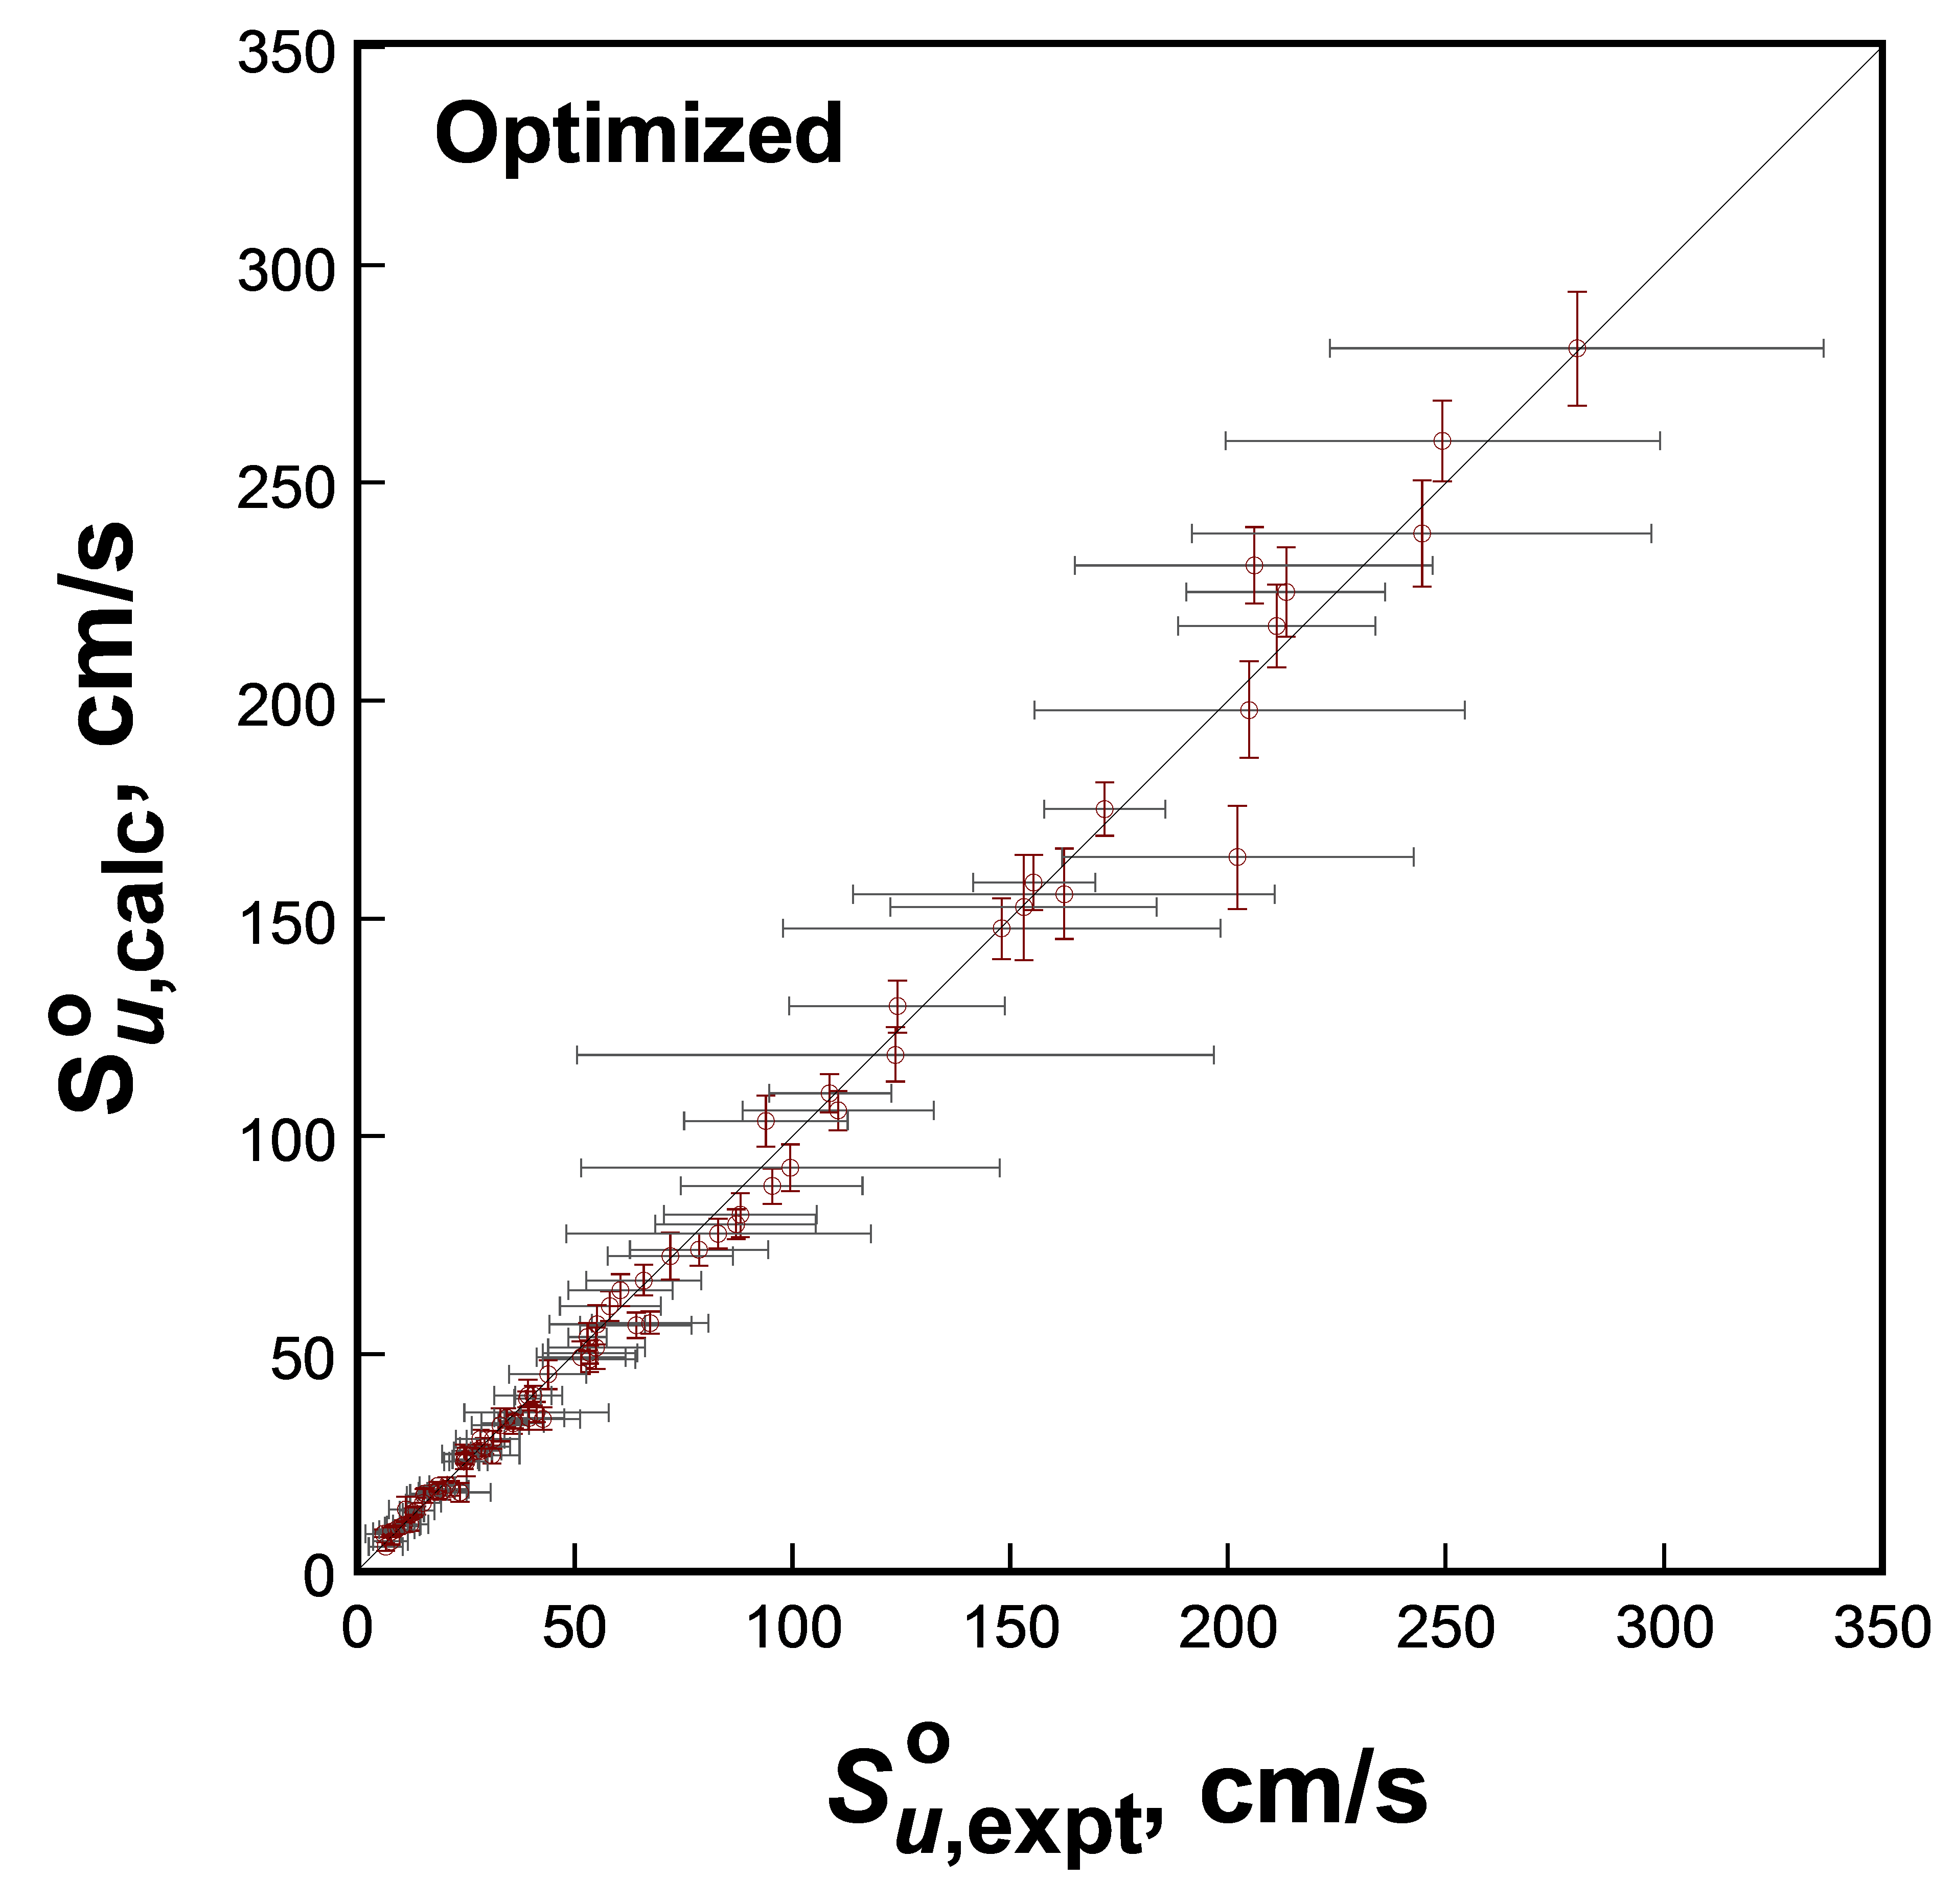
Figure 1. Comparison of the nominal flame-speed predictions and their uncertainties against experimental data. Left panel: the trial model, right panel: the optimized model (FFCM-1).
|
|
|
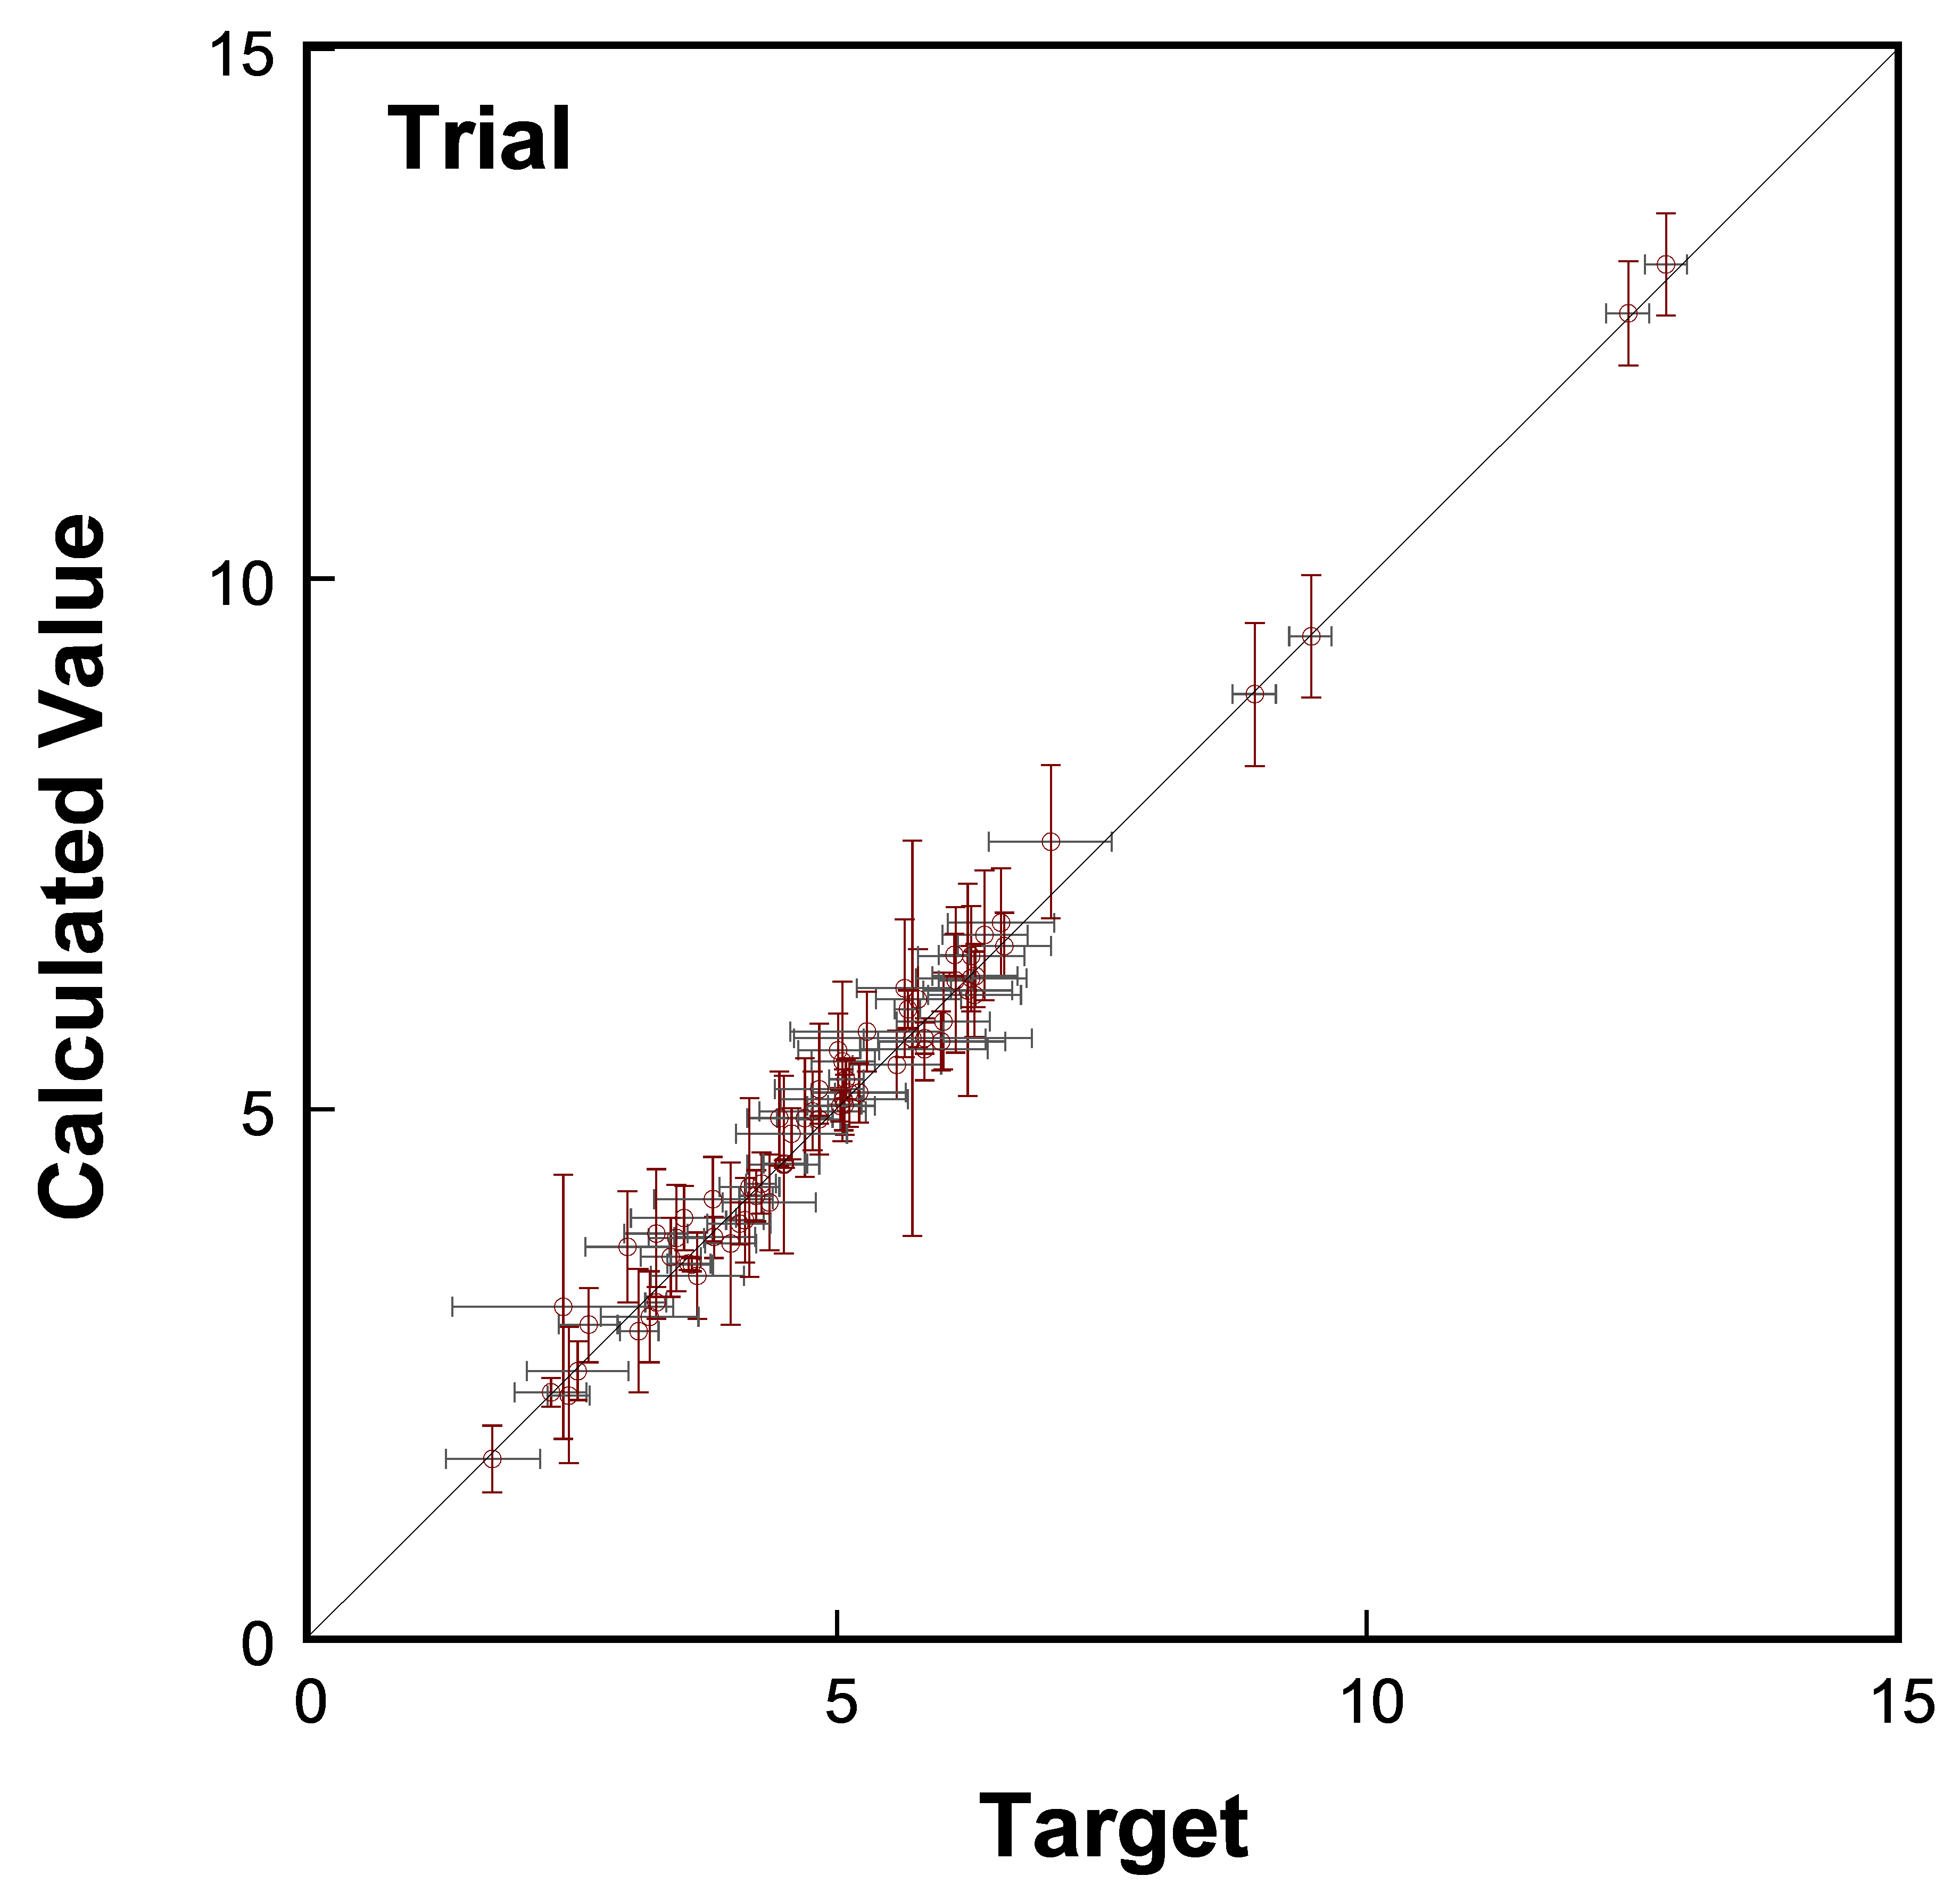
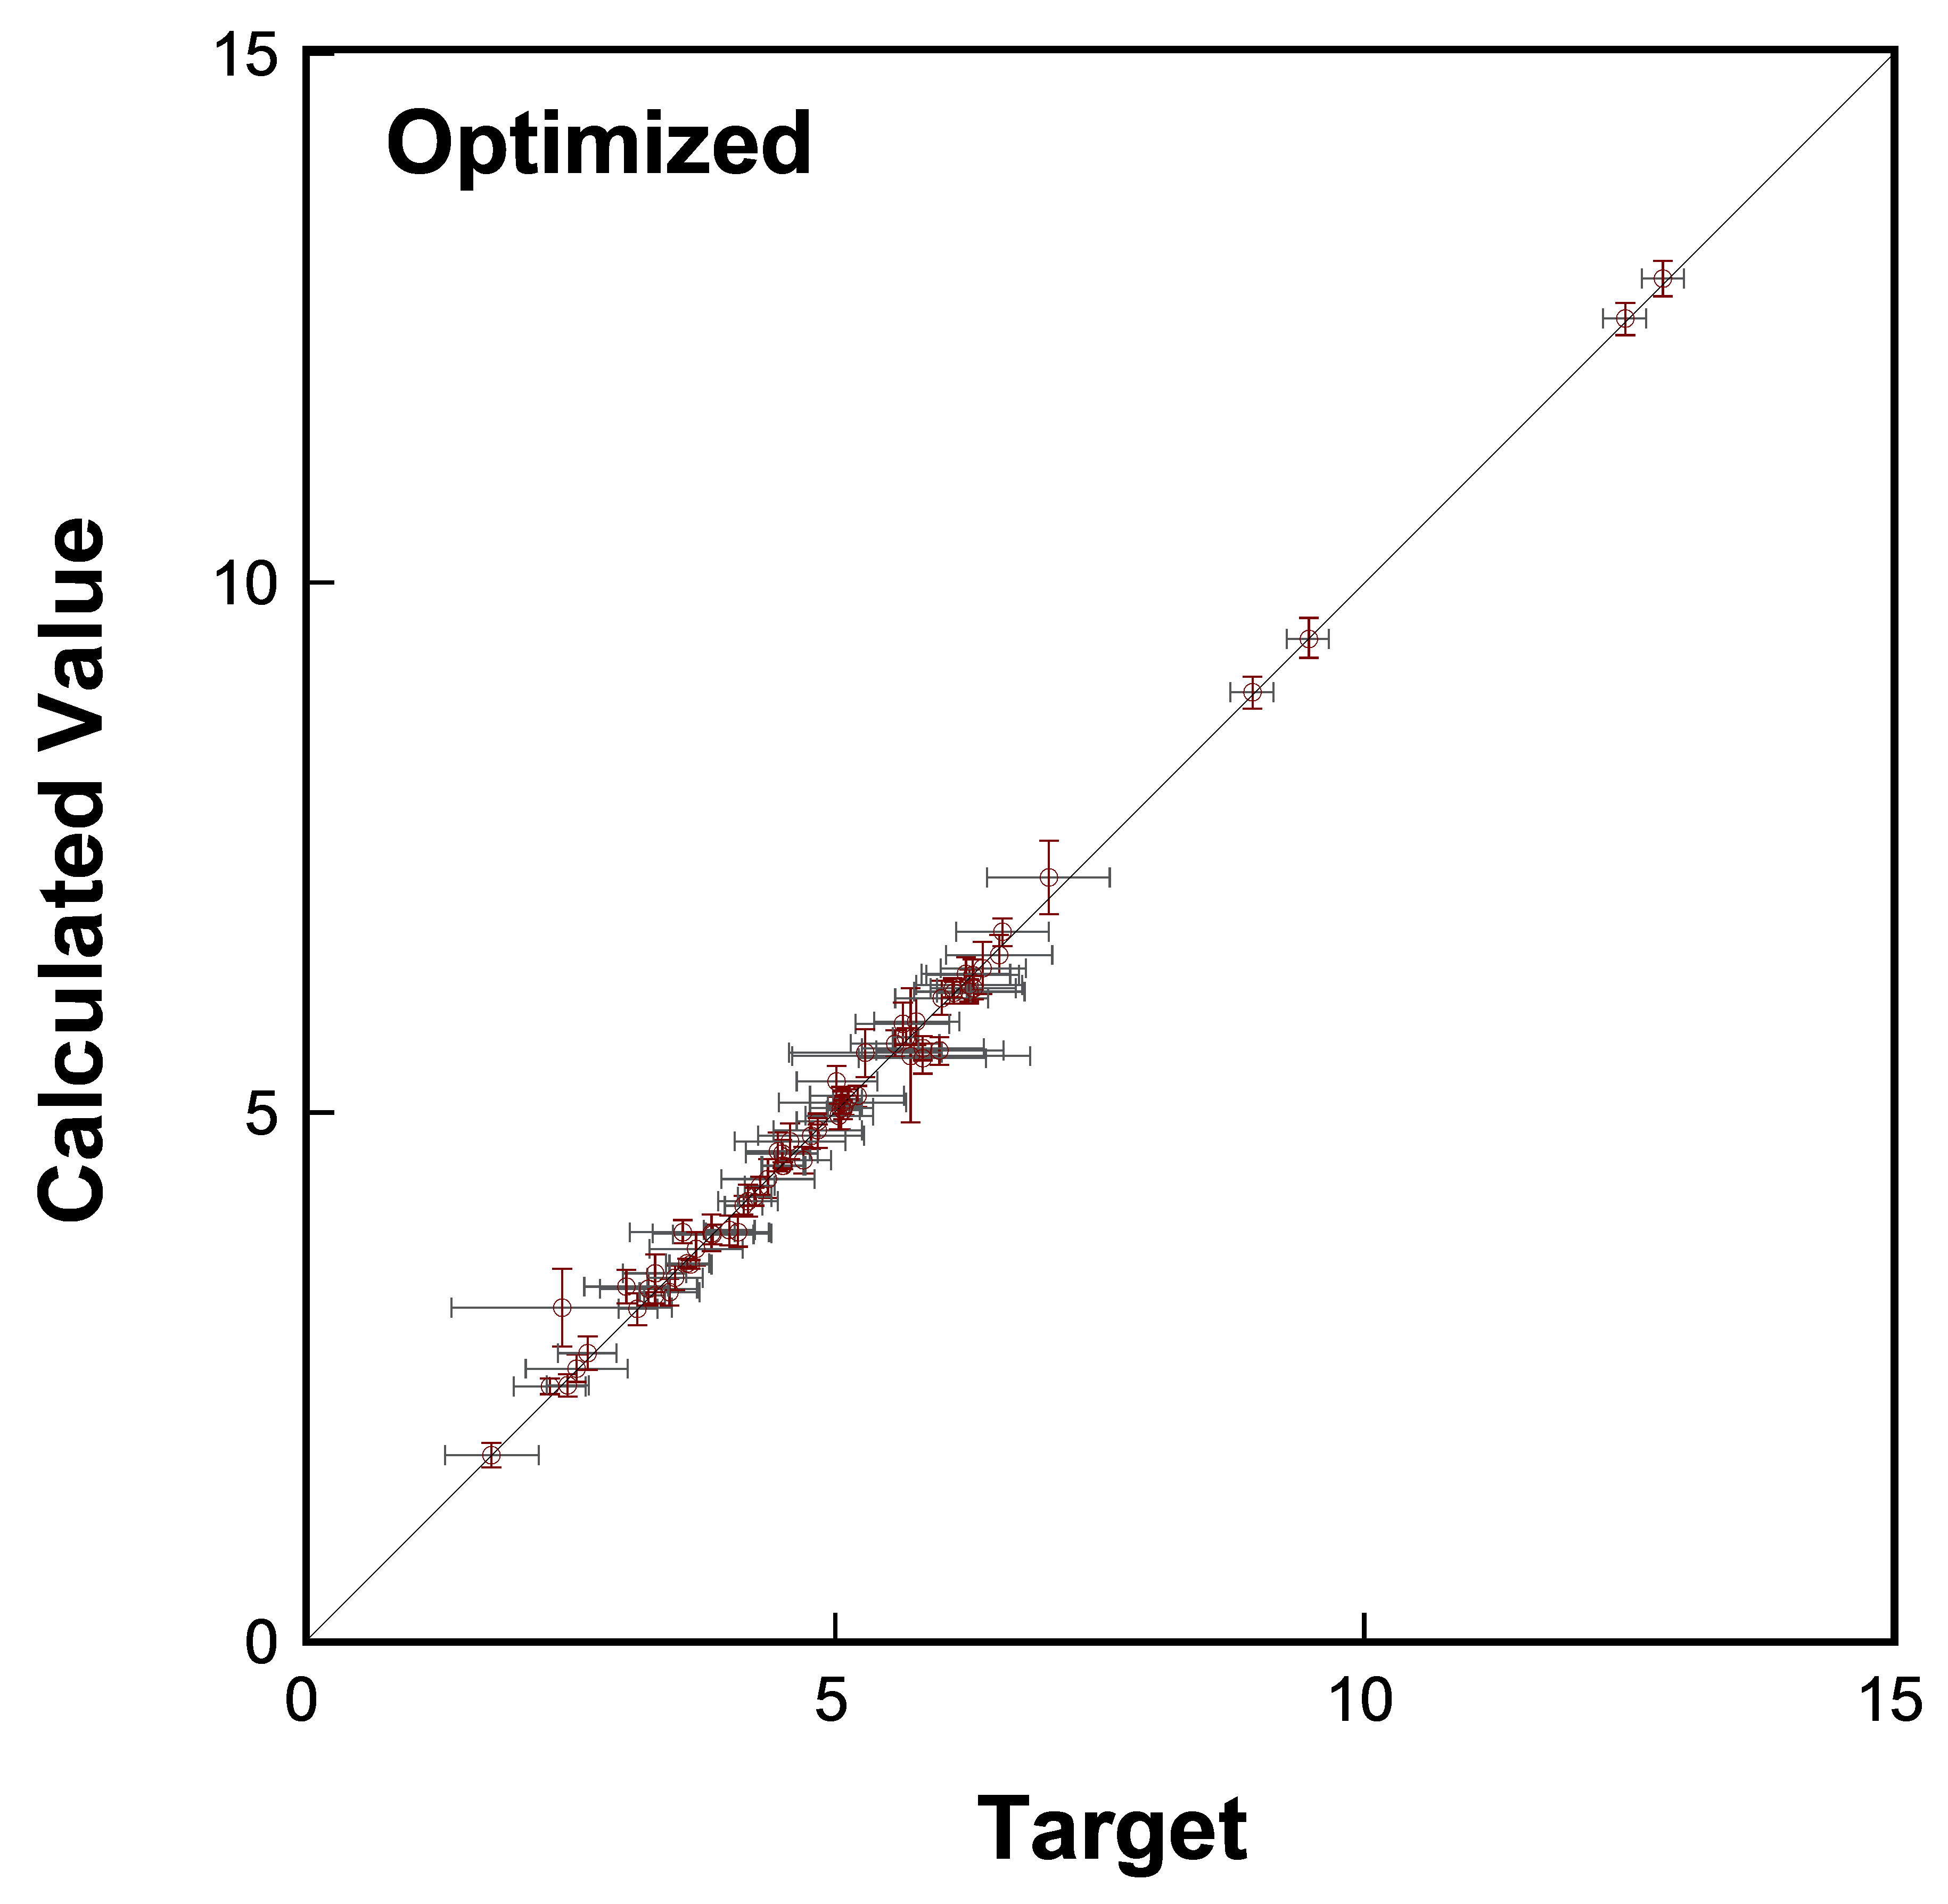
Figure 2. Comparison of the nominal shock-tube and flow-reactor target predictions and their uncertainties against experimental data. Left panel: the trial model, right panel: the optimized model (FFCM-1).
The ±2σ spans of reaction rate coefficients before and after the model optimization and uncertainty minimization procedure are shown in Figures 3a-f. In general, the optimized rate parameters are well within their original uncertainty bounds and have somewhat reduced overall uncertainties than the original uncertainty range. Reduction of the model prediction uncertainty is achieved largely through the covariance matrix (Figure 4 and 5), where the outermost ellipses span ±2σ in each dimension.
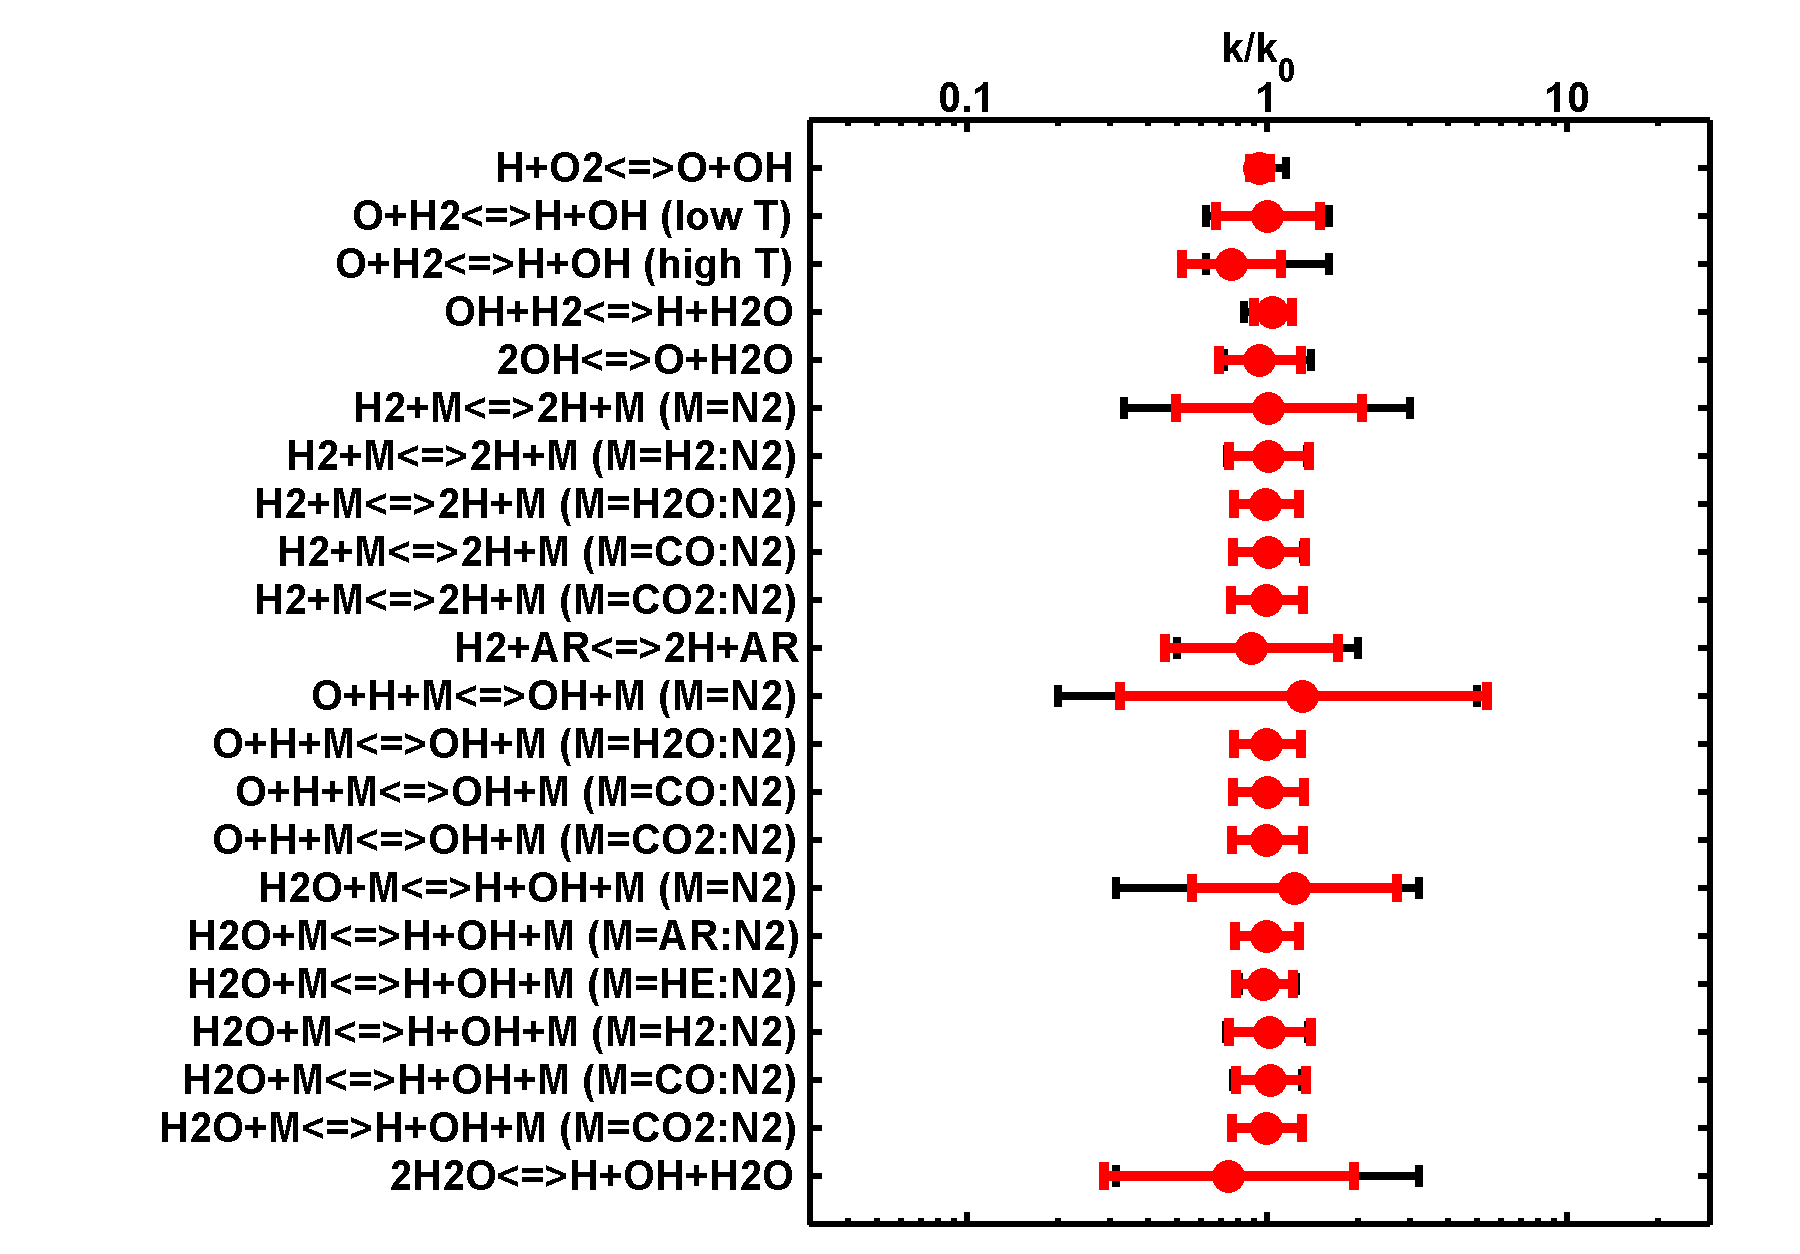
Figure 3a. Comparisons of upper and lower bounds of the rate parameters before (black) and after (red) rate parameter optimization and uncertainty minimization - the H2 subset.
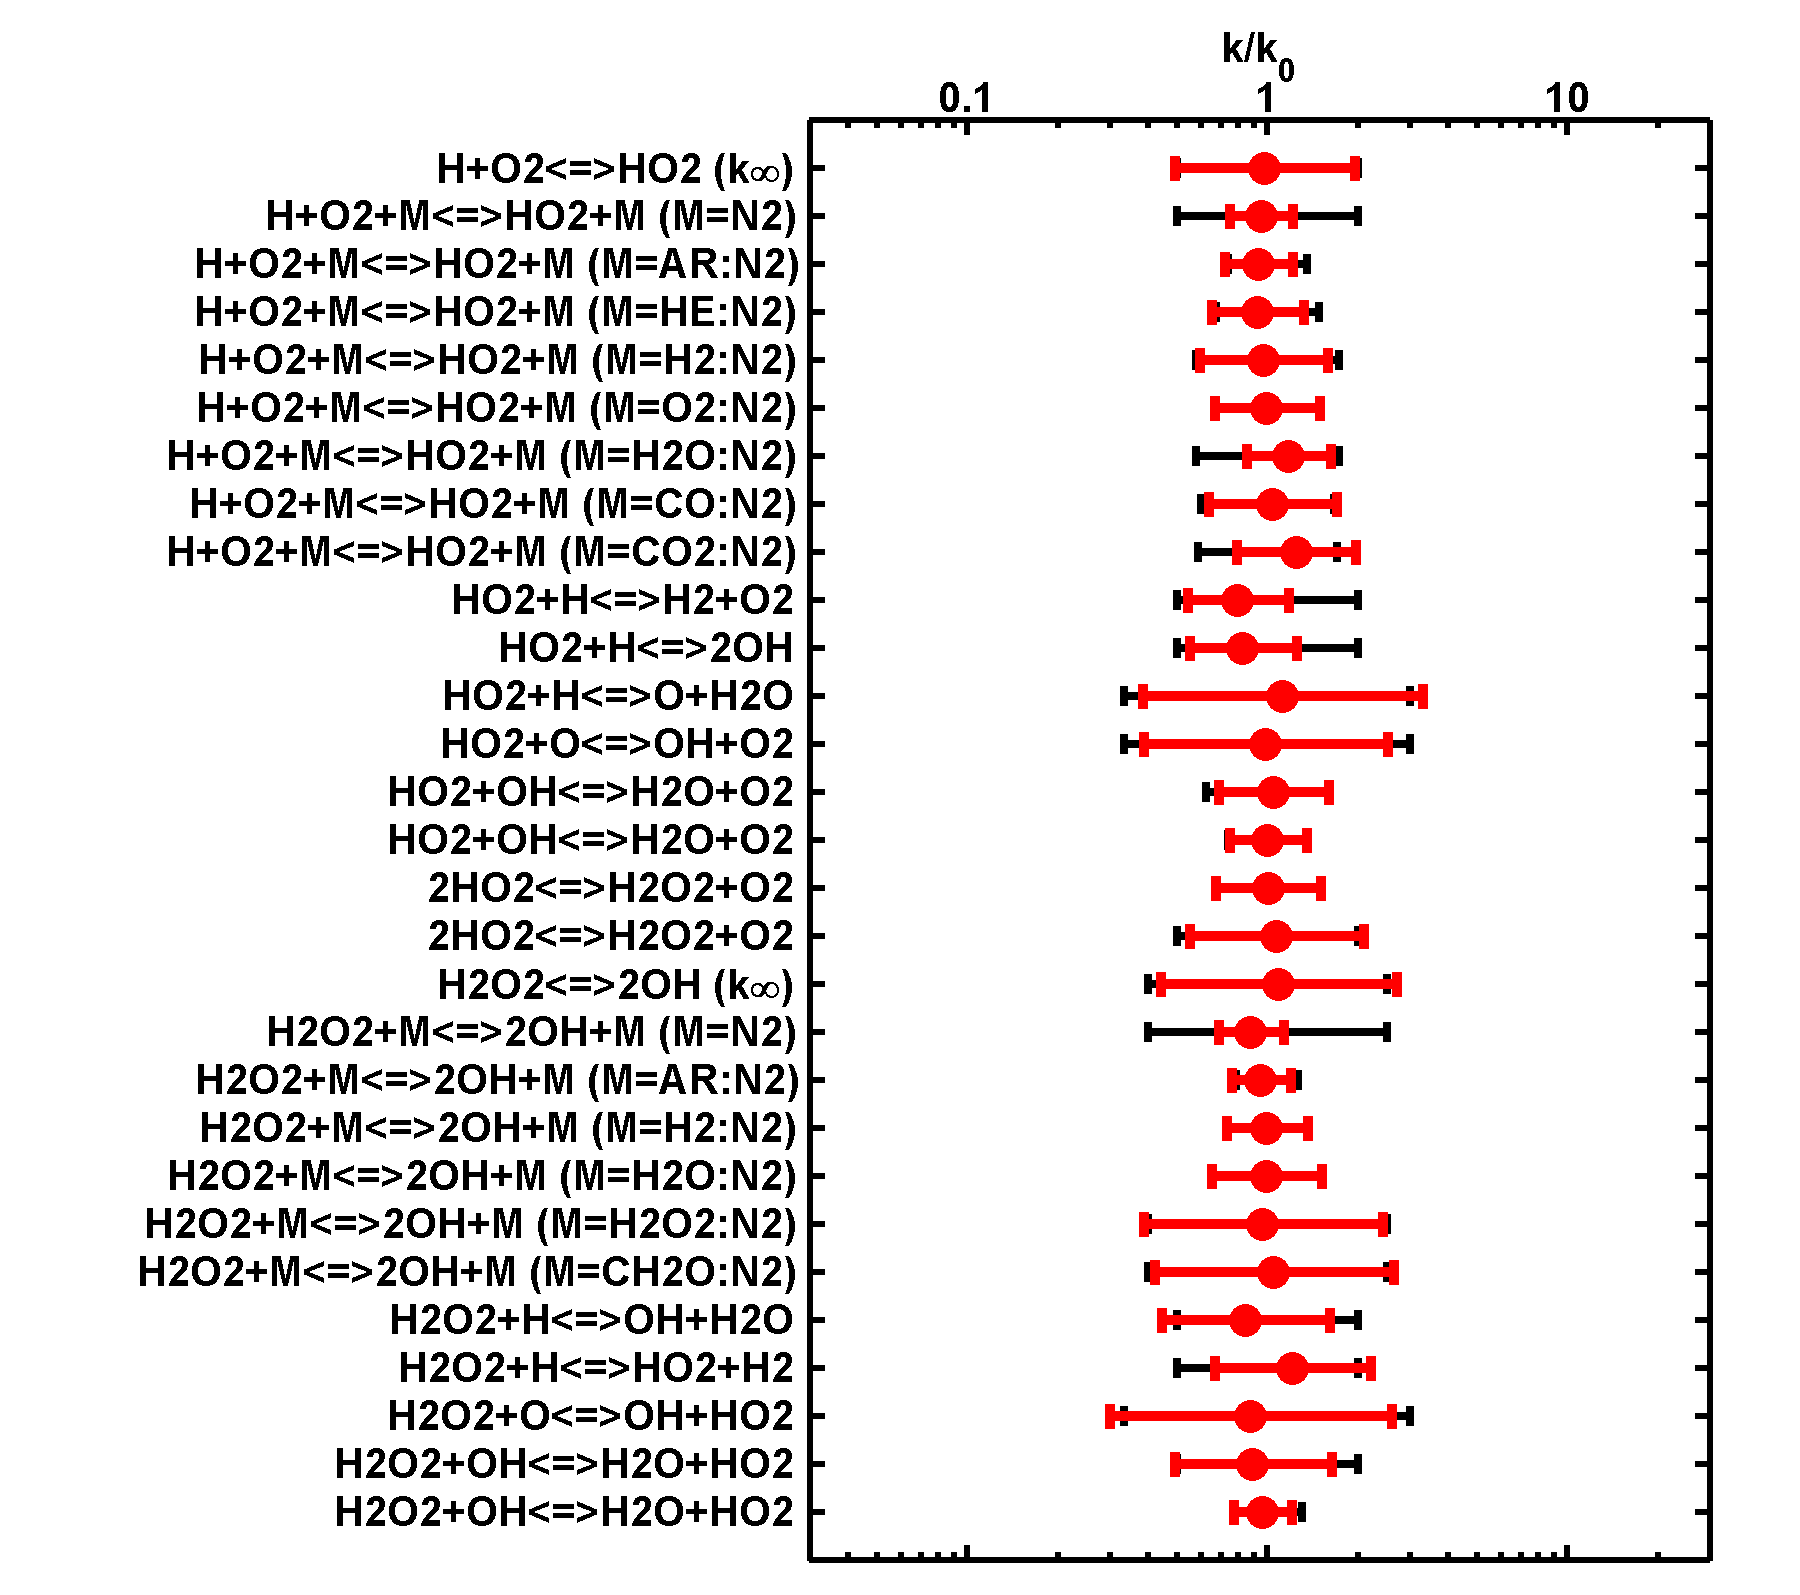
Figure 3b. Comparisons of upper and lower bounds of the rate parameters before (black) and after (red) rate parameter optimization and uncertainty minimization - the HO2 subset.
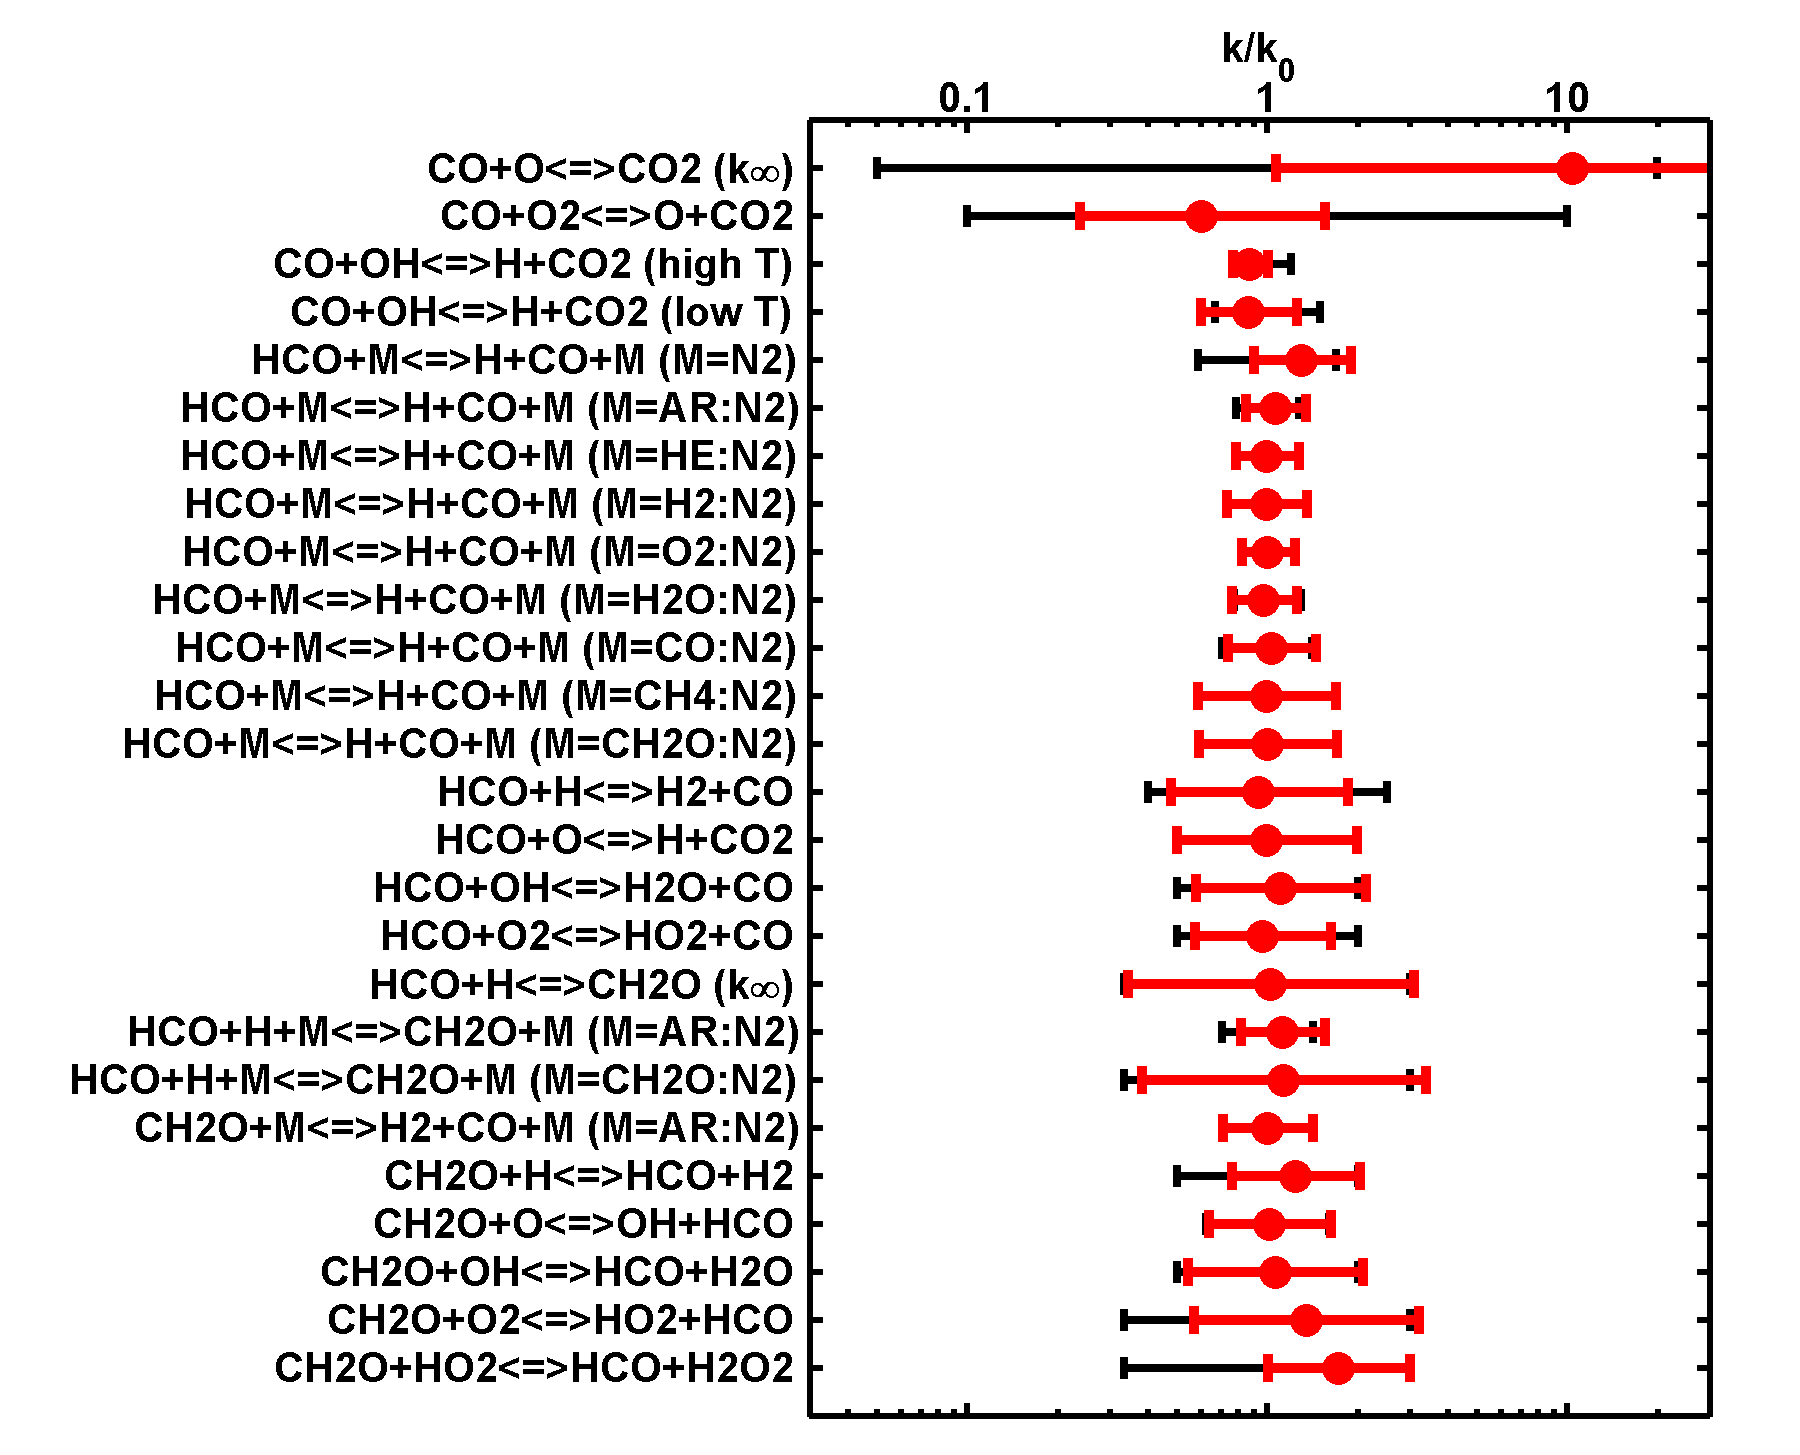
Figure 3c. Comparisons of upper and lower bounds of the rate parameters before (black) and after (red) rate parameter optimization and uncertainty minimization - the CO, HCO and CH2O subset.
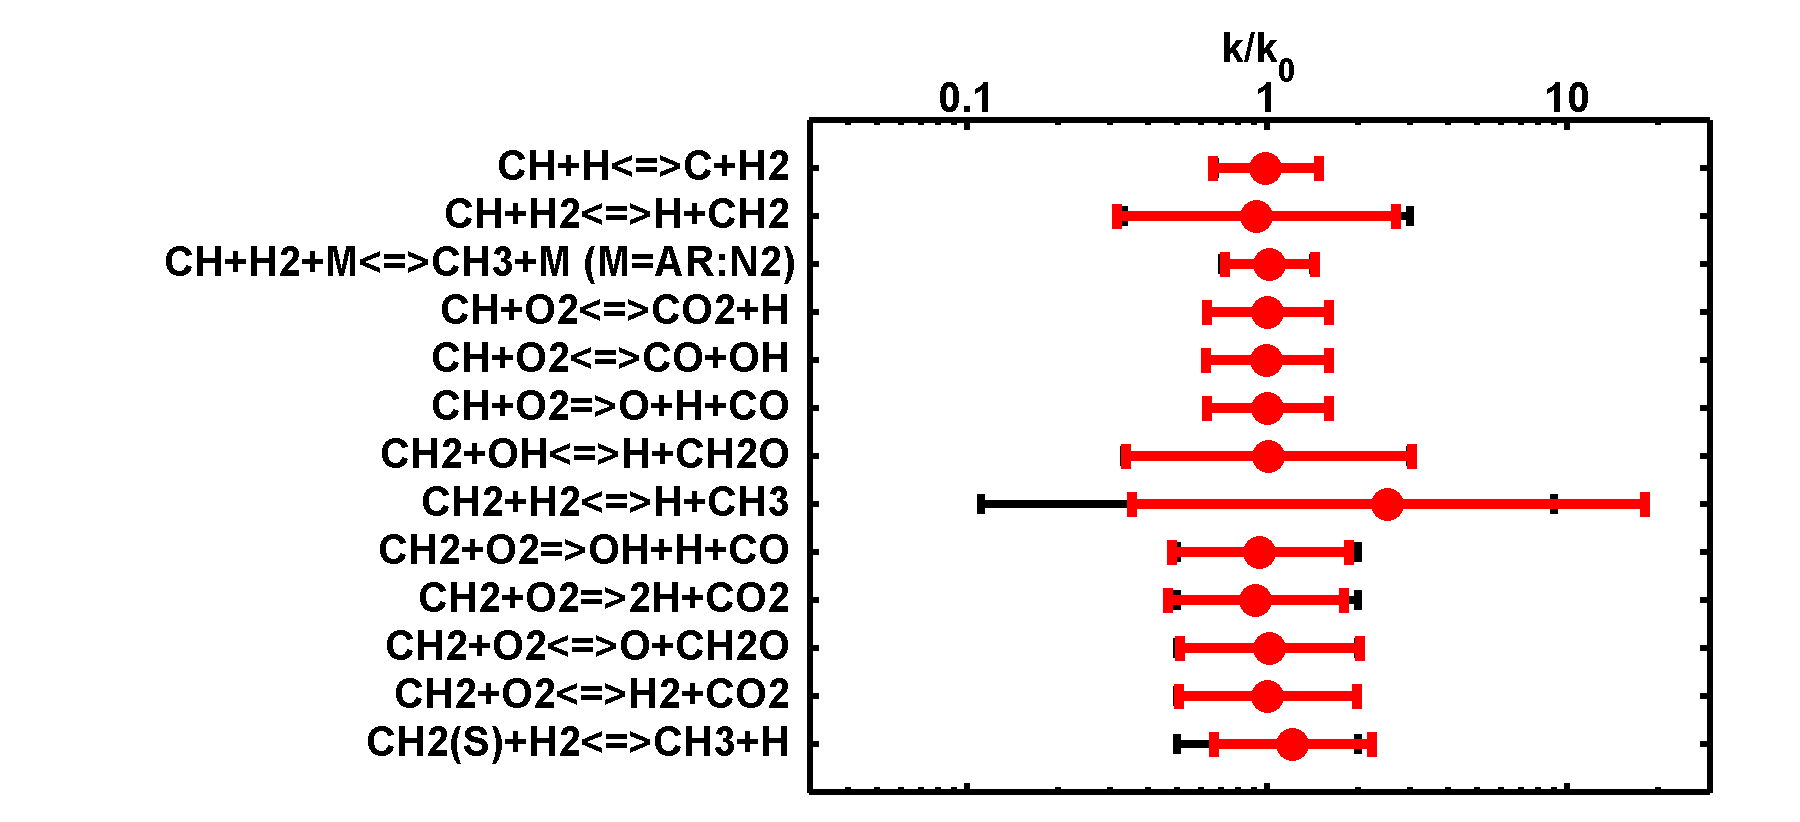
Figure 3d. Comparisons of upper and lower bounds of the rate parameters before (black) and after (red) rate parameter optimization and uncertainty minimization -- the CH and CH2 subset.
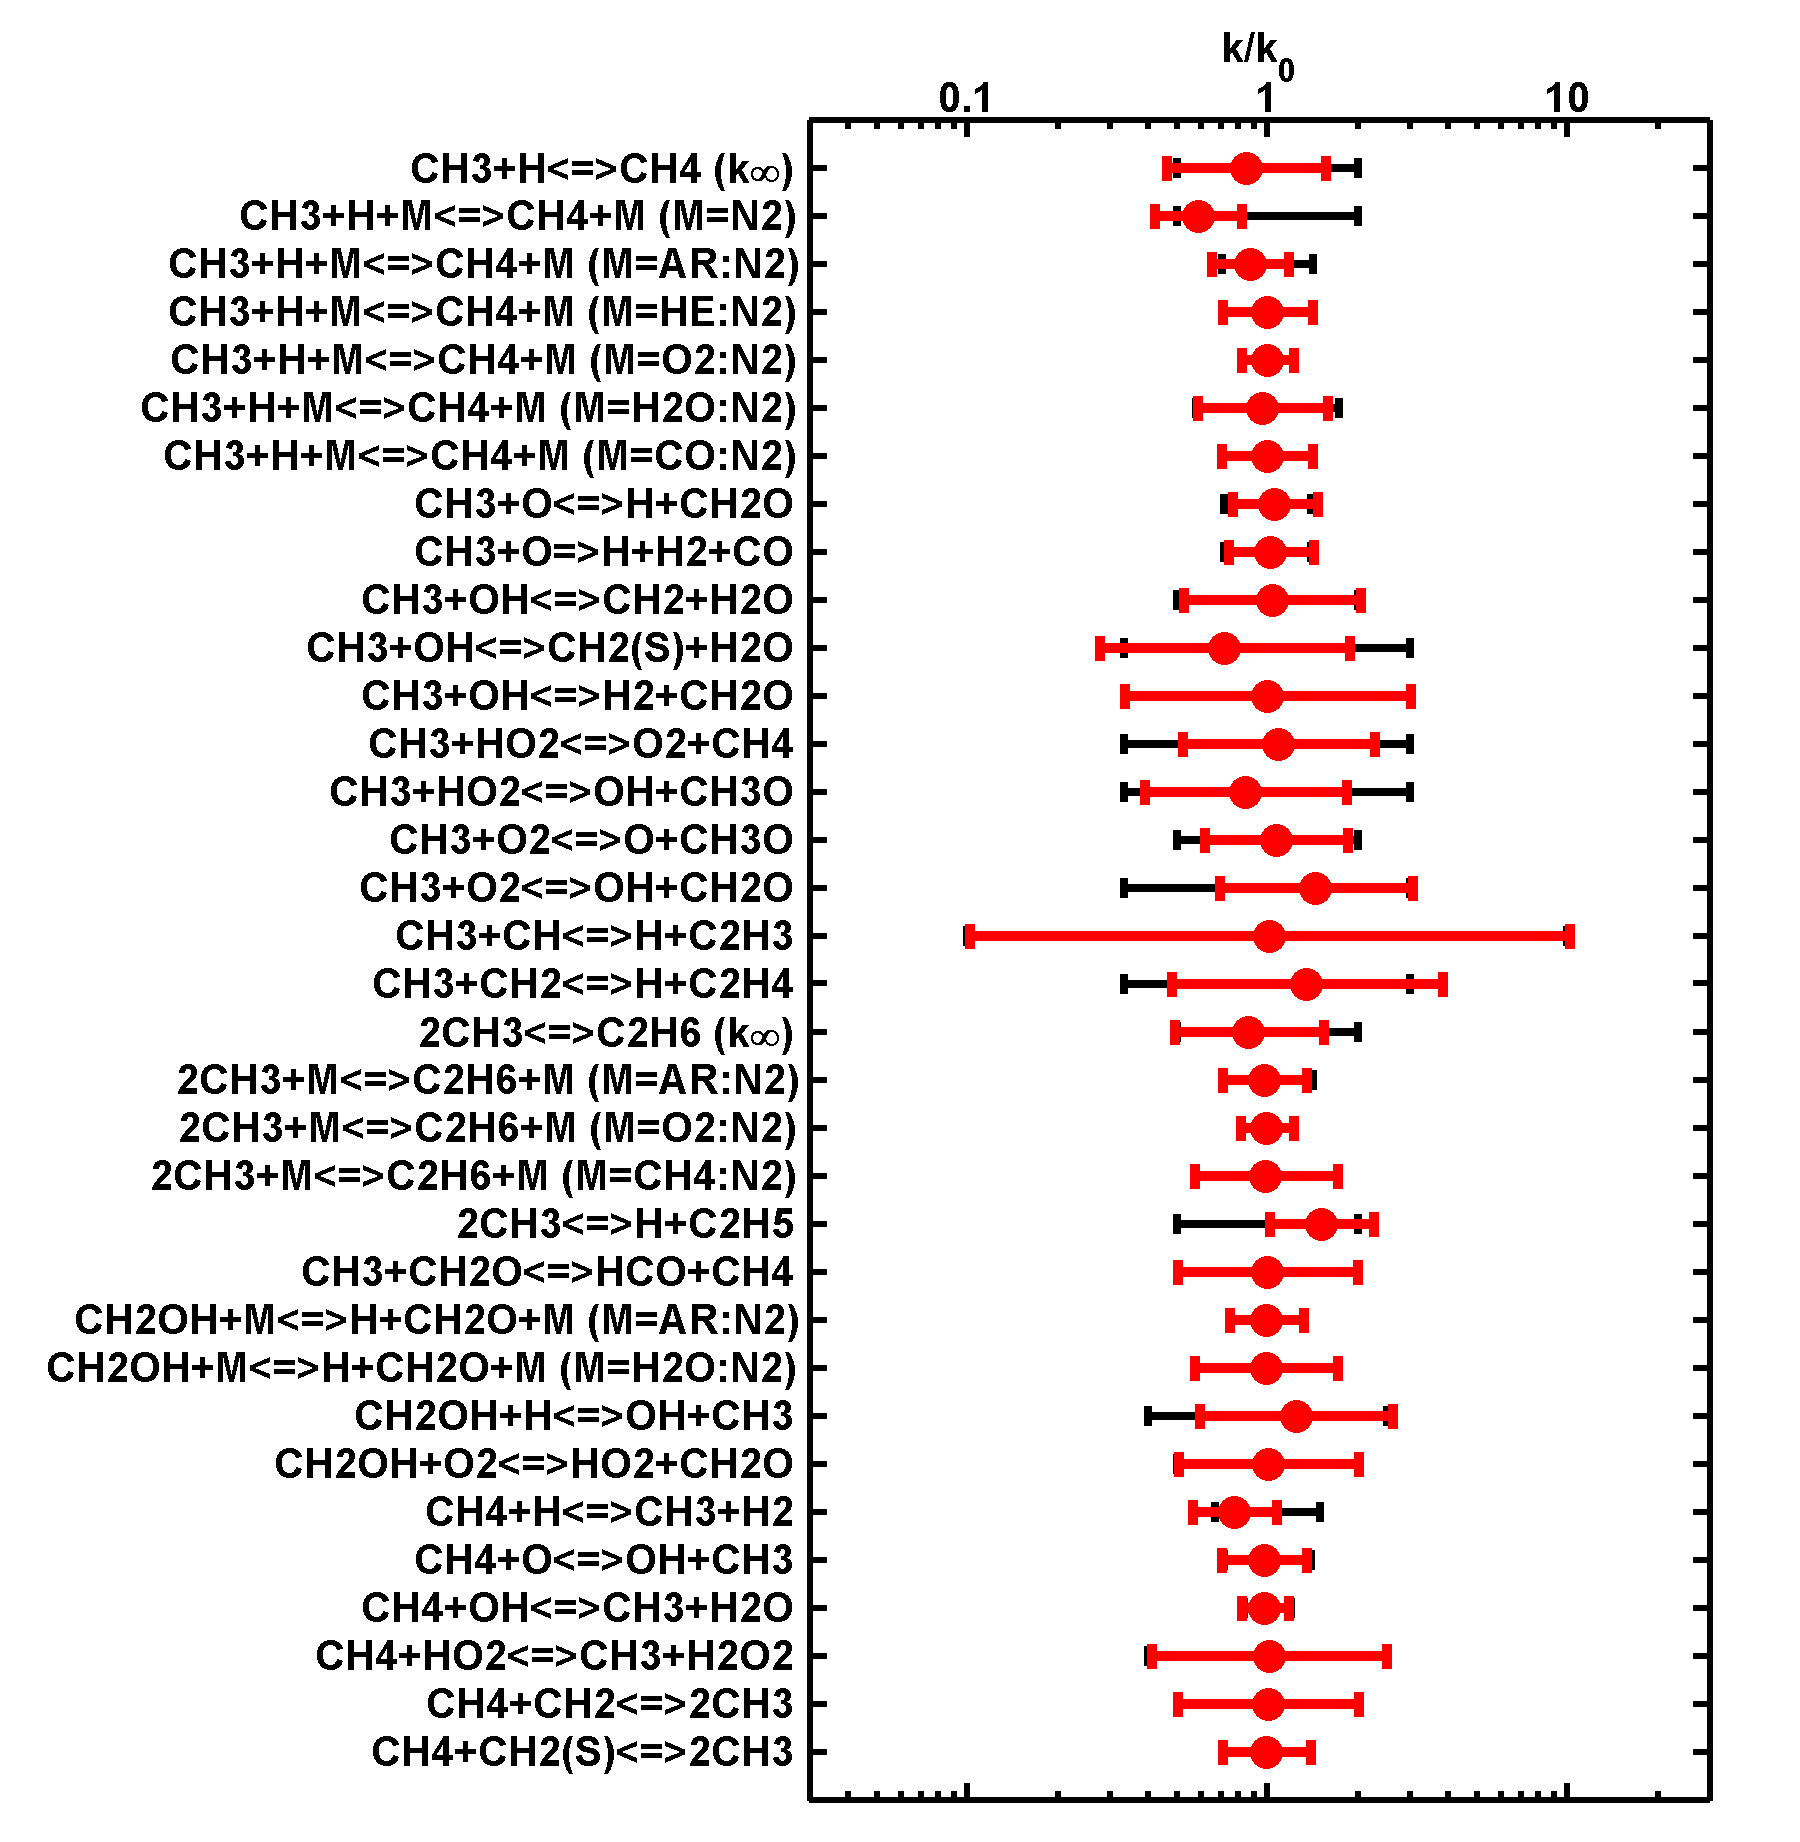
Figure 3e. Comparisons of upper and lower bounds of the rate parameters before (black) and after (red) rate parameter optimization and uncertainty minimization -- the CH3 and CH4 subset.
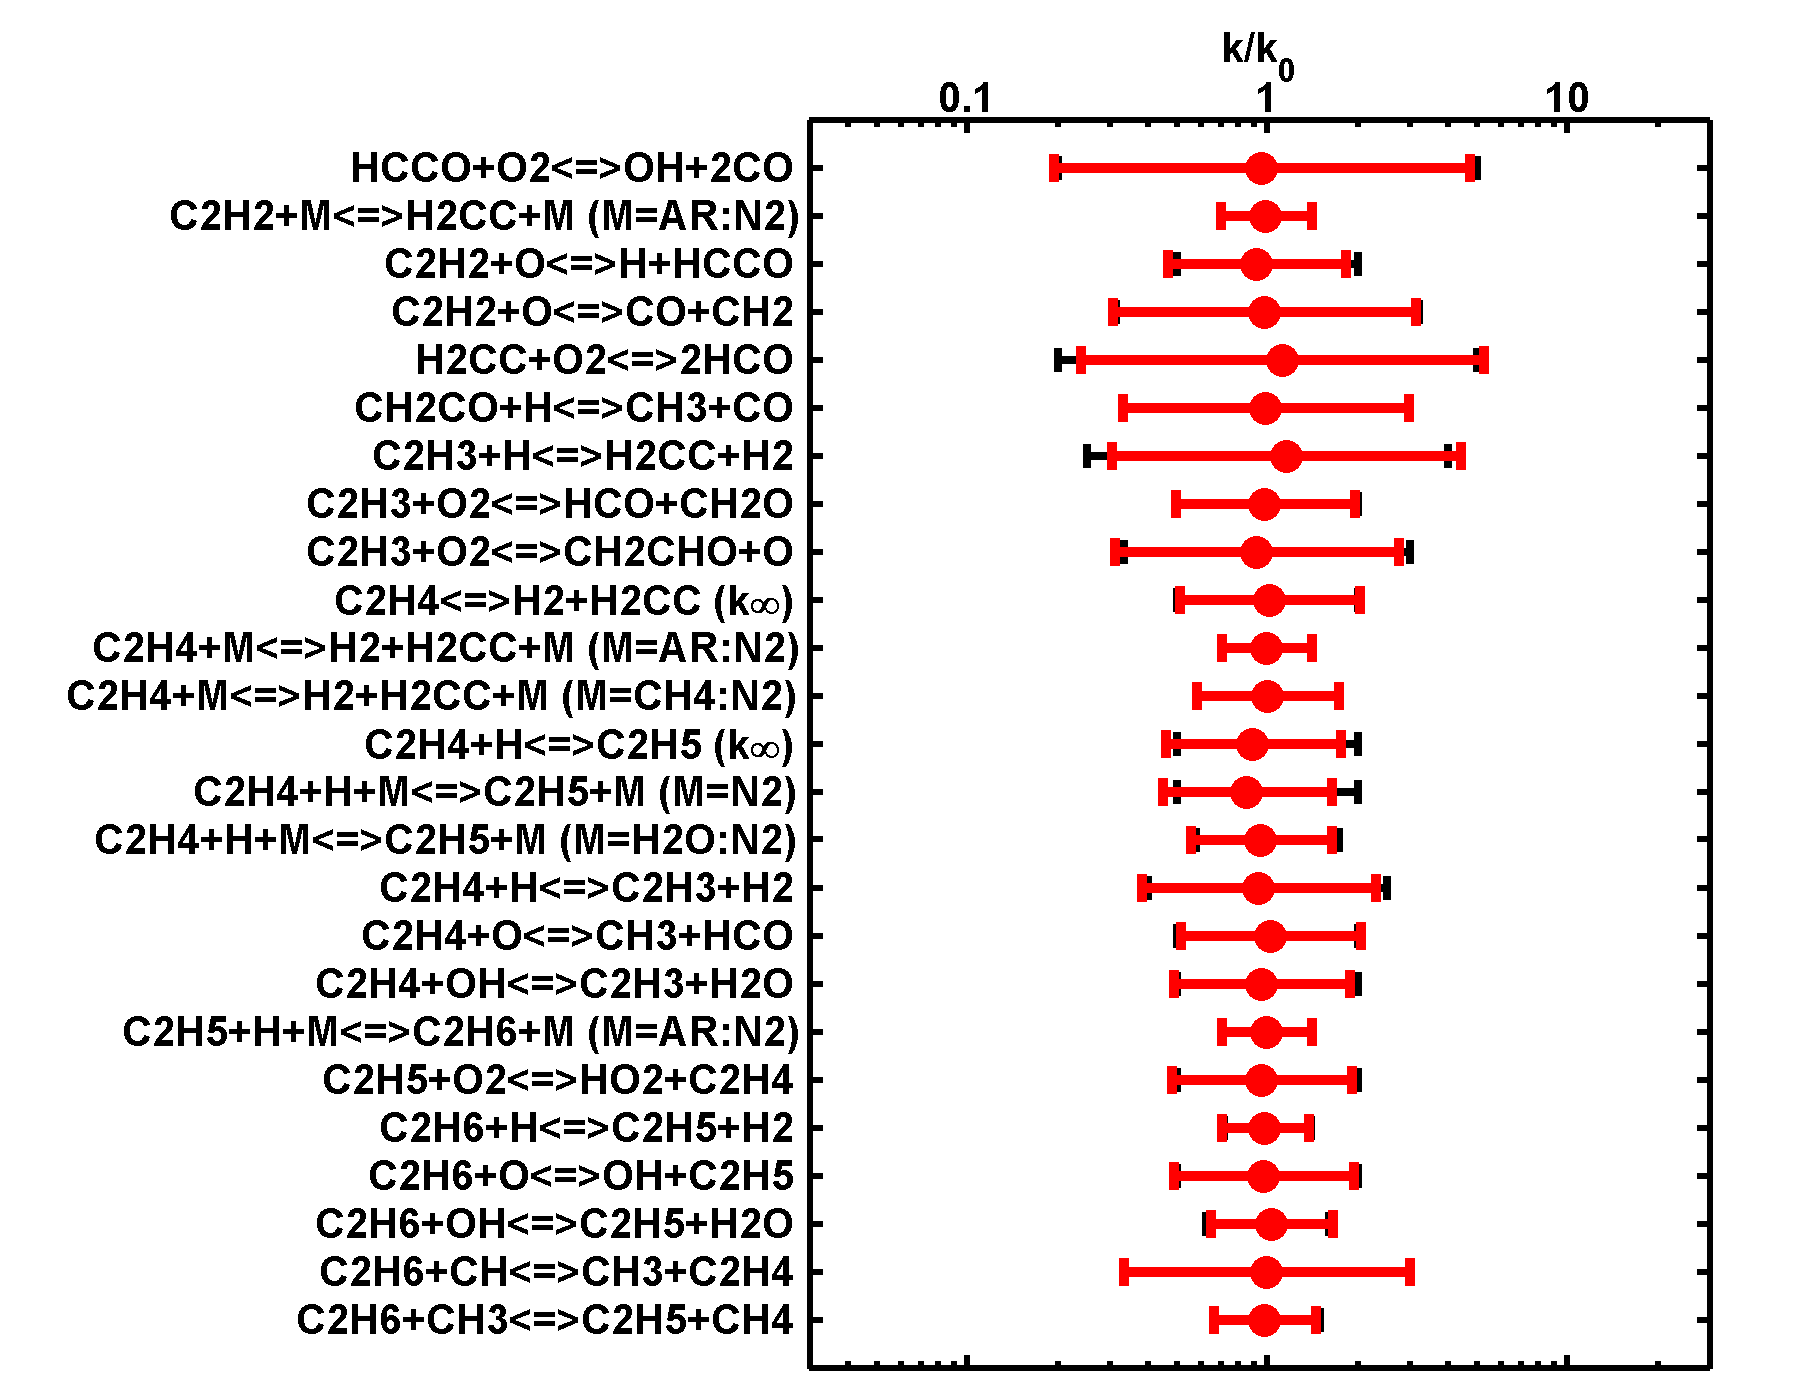
Figure 3f. Comparisons of upper and lower bounds of the rate parameters before (black) and after (red) rate parameter optimization and uncertainty minimization -- the C2 subset.
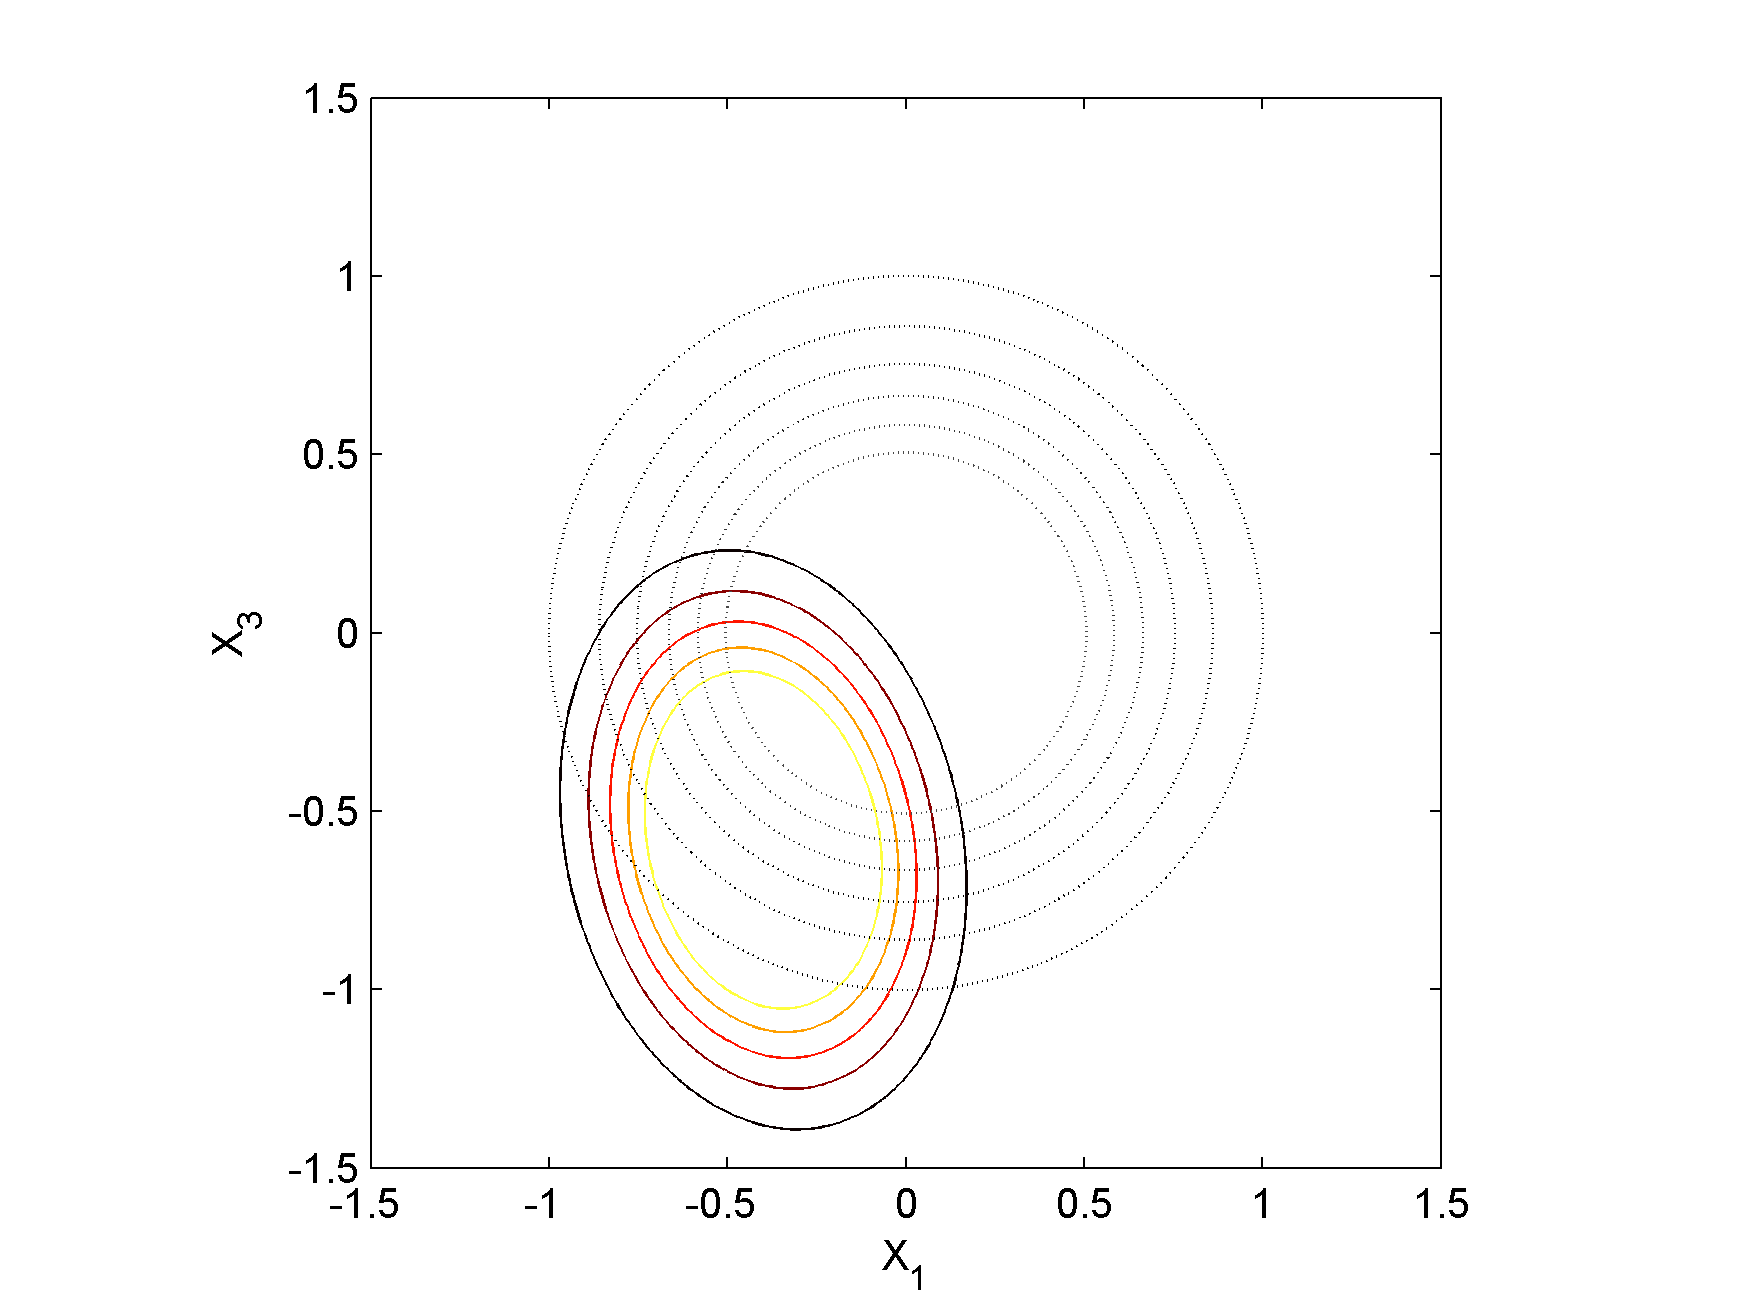
Figure 4. Sample covariance matrix contours of the rate parameters of reactions 1 (x1: H+O2<=>O+OH) and 3 (x3: the high-T part of O+H2 <=>H+OH). Grey circles: trial model; ellipses: optimized model.
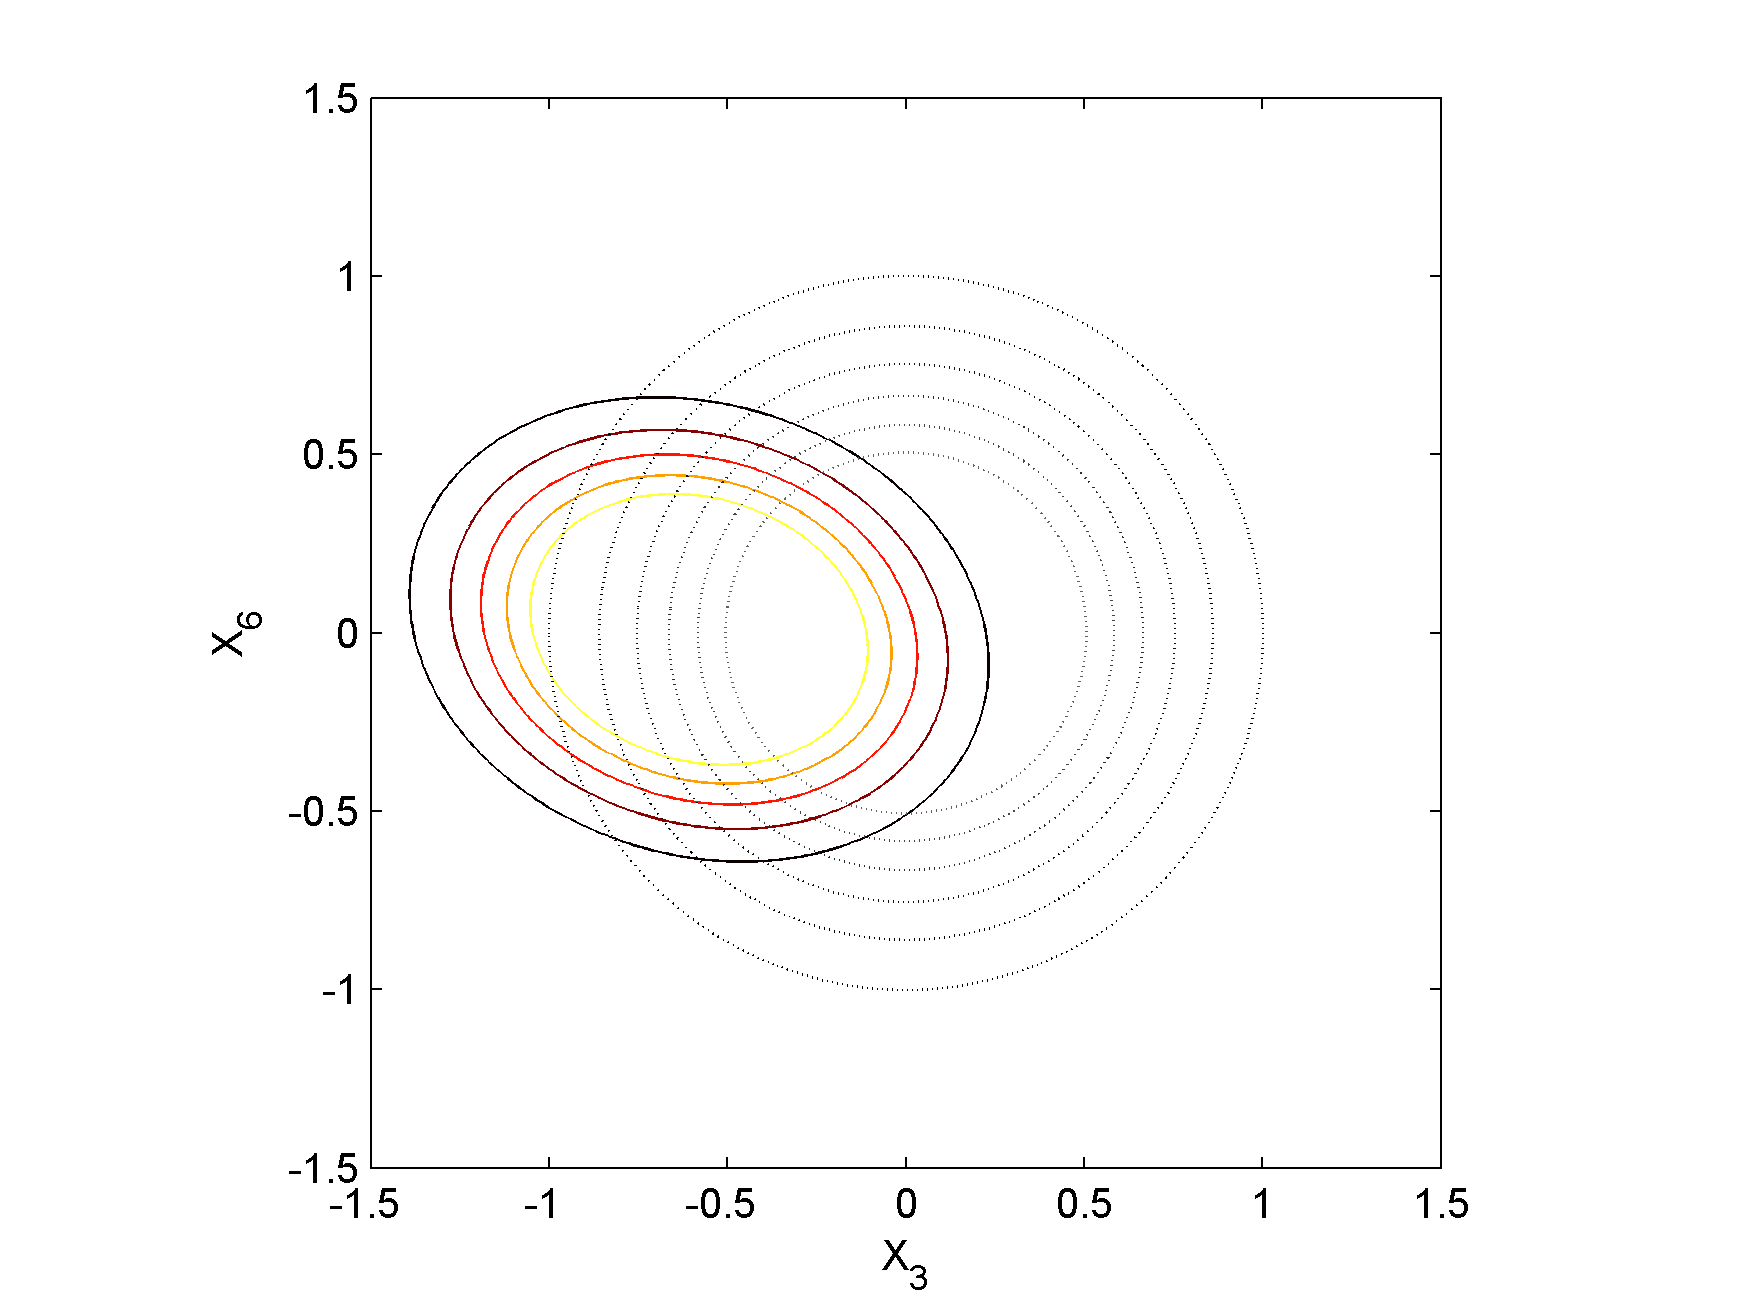
Figure 5. Sample covariance matrix contours of the rate parameters of reactions 3 (x3: O+H2 <=>H+OH) and 6 (x6: H2+M<=>2H+M). Grey circles: trial model; ellipses: optimized model.