
|
|
|
|
|


Preliminary Validation
Nominal predictions by the trial model can be found in the detailed pages for the targets. Shown below are sample validation plots of the trial model with calculated uncertainty bands. In the flame speed and ignition delay plots (Figures 1 and 2, respectively), uncertainty bands denote ±2σ of model predictions calculated from 200 random samples of rate parameters in the trial model uncertainty space. For the species profile plot (Figure 3), red curves are 200 random profiles predicted by these sample models.
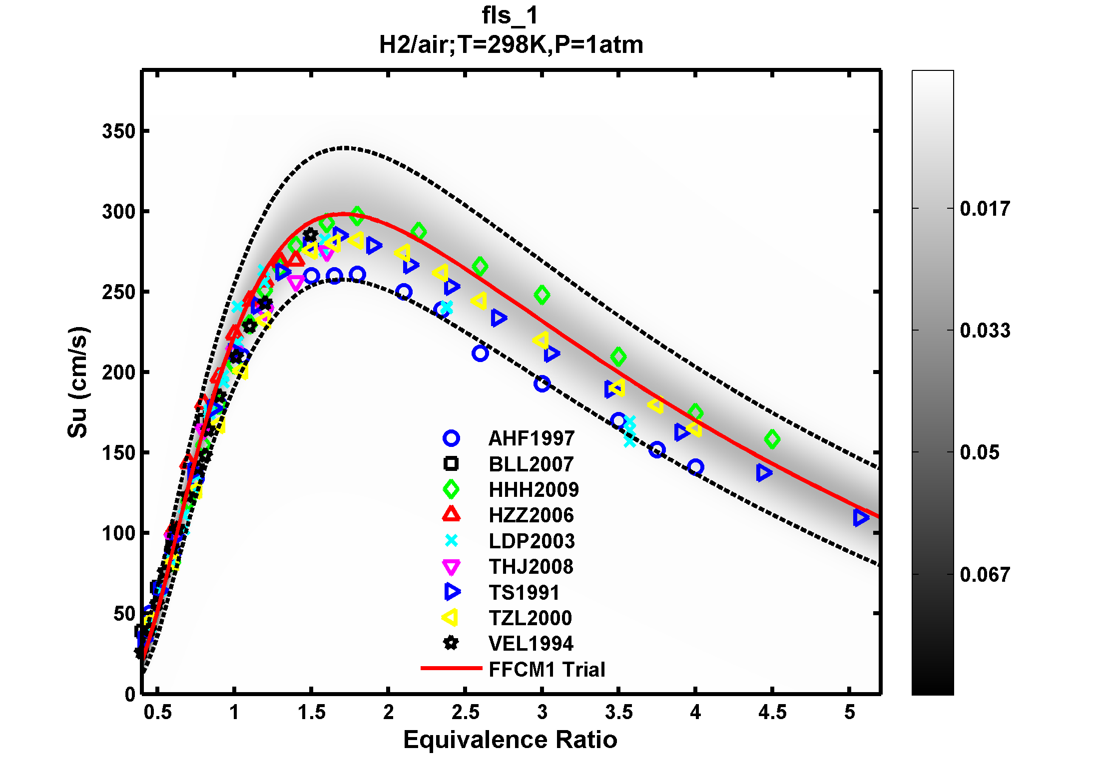
Figure 1. Laminar flame speeds of H2/air mixtures at 298 K and 1 atm. Symbols are experimental data (see the experimental target sheet for references); solid line is the nominal prediction of the trial model; dashed lines: ±2σ uncertainty lines of the model prediction; shaded area denotes the uncertainty probability distribution.
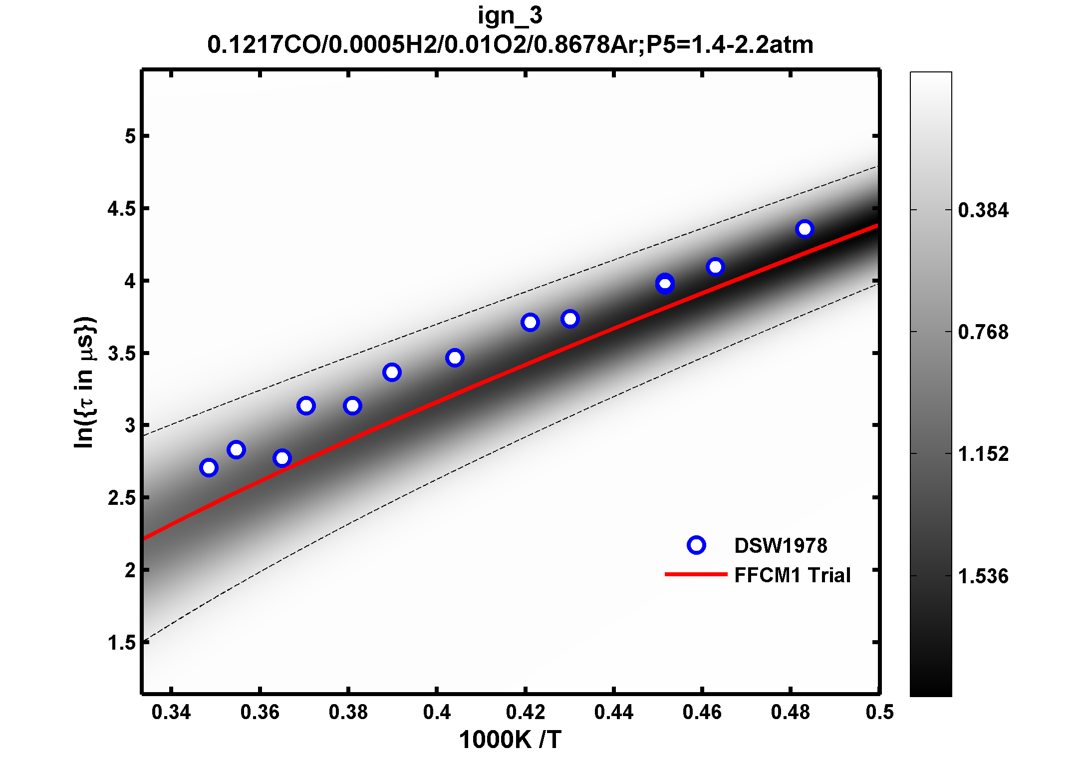
Figure 2. Ignition delay time of a syn-gas-O2-Ar mixture. Symbols are experimental data (see the experimental target sheet for references); solid line is the nominal prediction of the trial model; dashed lines: ±2σ uncertainty lines of the model prediction; shaded area denotes the uncertainty probability distribution.
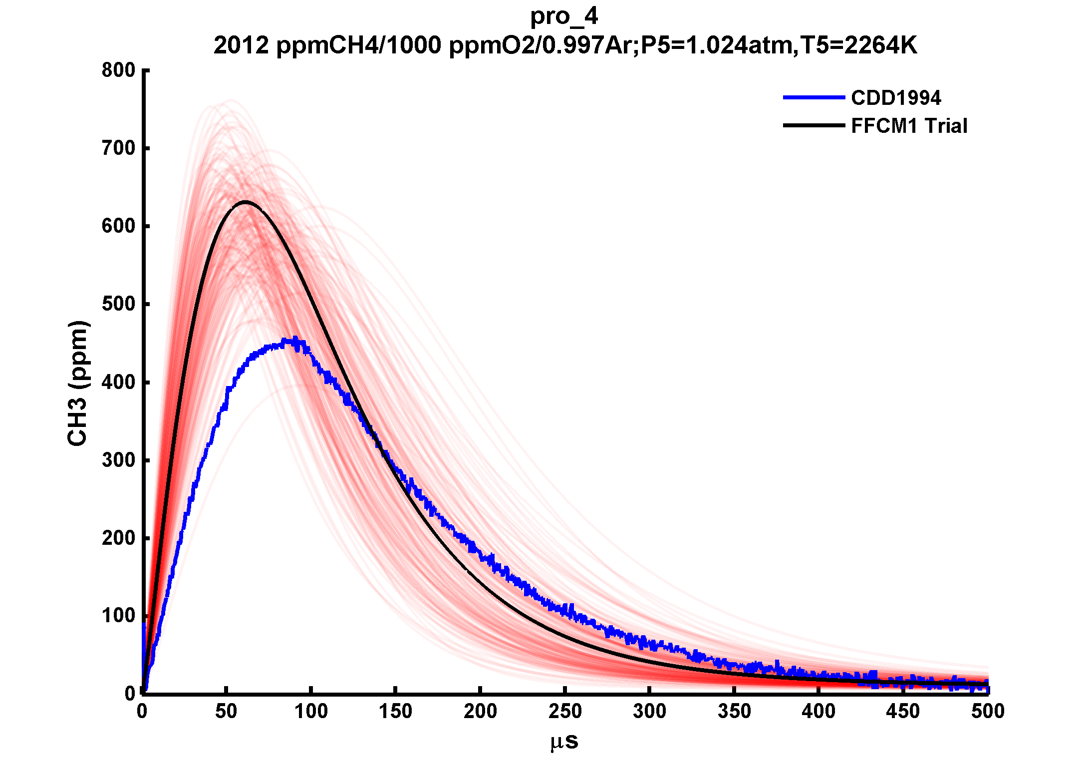
Figure 3. CH3 mole fraction profile during oxidation of CH4 in O2-Ar. Blue line is experimental data (see the experimental target sheet for references); black solid line is the nominal prediction of the trial model; thin, red lines: Monte Carlo sampling of the model uncertainty.