Assign4: Debugging warmup
This exercise will add a few new debugger tricks to your repertoire that will come in handy both for this assignment and further into the future.
Debugging objects
The files ball.h and ball.cpp define a Ball class that is used to encapsulate some information about a ball bouncing in a window, including the ball's x and y location, its velocity on both axes, and the window that the ball is located in.
First, look over the code to get acquainted with it. Each ball is created with an ID number that is used as the label when drawing the ball. The ID number helps identify which ball is which in the window.
There is one provided test for the Ball class. This test constructs many Ball objects and runs an animation loop to repeatedly move and redraw each ball.
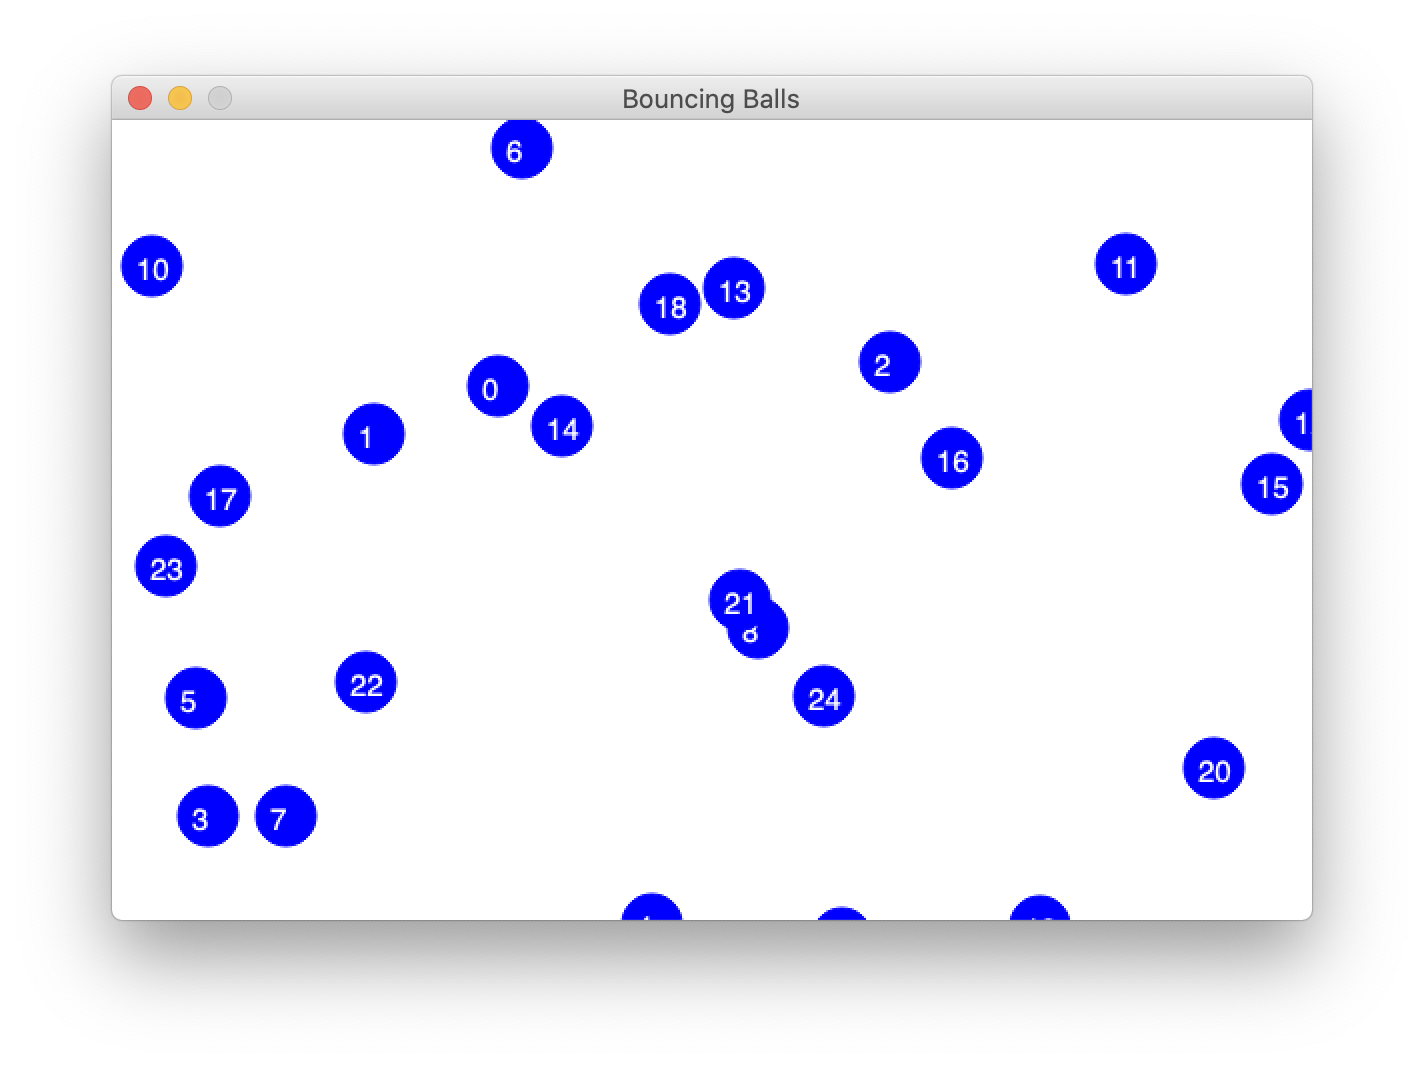
Run the program and select the tests for ball.cpp. A new window pops up and a swarm of numbered balls bounce around within the window. Cool! After about 20 seconds, the test completes and the window closes.
This version of the ball animation has a bug that sometimes causes balls to bounce incorrectly. You will use the debugger to help you track down the bug.
Run the program again under the debugger. While the balls bounce around, arrange the graphics and the debugger windows on your screen so you can see both simultaneously. In the debugger window, set a breakpoint on the line in ball.cpp where pause is called at the bottom of the animation loop. The debugger stops at this breakpoint almost immediately.
Click the Continue button ![]() to resume execution, and the program will execute another loop iteration and stop again at the breakpoint. Click Continue a few more times and keep an eye on the graphics window as you do this. During each iteration of the loop, all of the balls move slightly.
to resume execution, and the program will execute another loop iteration and stop again at the breakpoint. Click Continue a few more times and keep an eye on the graphics window as you do this. During each iteration of the loop, all of the balls move slightly.
Object member variables
When stopped at the breakpoint, look at the "Variables" pane in the upper-right of the debugger window. Click the triangles to expand the allBalls Vector, its _elements, and the elements at indices [0] and [1]. Each element is one Ball object. An object has its own private versions of the member variables, so each ball has its own position (x,y), velocity, and ID.
Click Continue a few more times, observing the updates to the member variables for allBalls[0] and allBalls[1] in the Variables pane and match that to the movement of those balls in the graphics window.
Note: If the vector contents display as <not accessible>, follow the instructions to configure your Qt debugger to properly display Stanford collection types.
Answer this question in short_answer.txt:
- Q1: How do the values of the member variables of
allBalls[0]change from iteration to iteration? Specifically, what happens to the values ofid,x, andy?
The variable this
Now click on the red dot for your previous breakpoint to delete it. Set a new breakpoint on the first line of the Ball::move method. Make sure to do this without stopping and restarting the debugger so that the program continues to execute until it hits the new breakpoint. The debugger will now stop on each ball move. When stopped at this breakpoint, look at the variables in the Variables pane. Because the program is currently inside a C++ member function, there is a special variable called this that refers to the object currently executing the member function. When stopped inside the function Ball::move, this refers to the specific ball that is taking its turn to move. Expand this to see the member variables of the object. Use this ball's position and ID to locate the corresponding ball in the graphics window.
Click the Continue button to resume. The breakpoint is hit again on the next call to Ball::move. Note that this now refers to a different Ball object with its own member variables. Click Continue a few more times to see some other balls take their turns to move.
Control-click on the red dot for your breakpoint to bring up the pop-up menu and choose Disable breakpoint. This leaves the breakpoint in place but makes it inactive. It is marked with a dim red dot. Use Continue to resume execution, and the balls should freely animate without stopping.
Debugging in the context of randomness
When the program begins, each ball is created with a starting position and velocity; these values are chosen randomly. Quit and restart the program a few times to observe how the initial configuration varies from run to run. Debugging a program that has random features can be challenging as you may not be able to reproduce a particular scenario at will. Sometimes your best option is to just keep an eye out for an intermittent bug and opportunistically jump into debugging whenever you encounter it.
If you run the program a few times, you may notice that occasionally a ball or two gets "stuck" along the bottom or right edge of the window. This is the bug we are trying to diagnose. Let's see if we can get this under the debugger to investigate further.
Quit and restart the program in Debug mode until you get a starting configuration where at least one ball is stuck and enough of the stuck ball is visible that you can see its ID number. (It may take a few tries.)
Control-click on the dim red dot for the disabled breakpoint in Ball::move and choose Enable breakpoint from the pop-up menu. With this breakpoint active, it stops at every single move for every single ball. Since there are many balls and each moves many times per second, having to stop and continue on each move is very tedious. We would much rather zero in on the ball in trouble. For example, in this case, we know the ID of the stuck ball. Ideally, we want to step through the move of only that ball, and zip past the others.
Conditional breakpoints
The debugger has just the thing we need: a conditional breakpoint. A condition can be added to a breakpoint to tell the debugger to only stop the program at this breakpoint if a certain condition is met.
Control-click on the breakpoint's red dot and choose Edit breakpoint from the pop-up menu. Look for the text field labeled Condition. The condition is any C++ expression that is valid to be evaluated at the breakpoint location. It can refer to any local variables and parameters. Each time execution reaches the breakpoint location, the condition is re-evaluated, and the debugger stops only if the condition evaluates to true; otherwise, it behaves as if the breakpoint were inactive and just continues on.
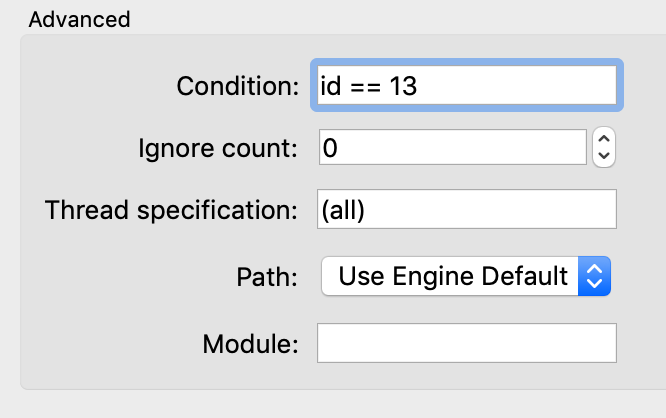
Let's try it out! Add a condition on the breakpoint to only stop if id is the ID number of the stuck ball in your configuration. The breakpoint in Ball::move will only stop when executing for the stuck ball. Each Continue should take the program straight through to this particular ball's next move.
(Instructor's Note: We have found the Qt debugger to be a little flaky when handling breakpoint conditions. Sometimes it stops even when it shouldn't, but continuing once or twice seems to straighten it out. Your patience and tolerance will be rewarded; conditional breakpoints can be a great help for debugging a complex situation. Advanced features like this can stress out the debugger, so if you give it a few tries and it won't cooperate, just note that in your answers and move on.
Focus on observing what's happening to the stuck ball on each move. Do a couple of rounds with Continue, noting how the values of its member variables are changing. Contrast what is happening for the stuck ball to what you observed earlier for a correctly moving ball.
Answer the following question in short_answer.txt:
- Q2: What is the pattern to how the values of the member variables of the stuck ball change from iteration to iteration?
Changing variables in the debugger
You have a hunch that forcibly moving the stuck ball to a different position would cause it to fix itself. The Variables pane of the debugger allows you to change the value of a variable in a running program. Double-click to edit the x and y fields and place this ball at position (0, 0). The next time this ball is drawn, it should appear in the upper left corner of the graphics window, where you have teleported it.
(Note: Sometimes the Qt debugger is unable to process your update to the variables and reverts to the previous value. If this happens to you, just note it in your answer to the question below).
Answer the following question in short_answer.txt
- Q3: After placing the stuck ball at (0, 0), does it move normally from there or does it stay stuck?
Given the above detective work, do you see what caused the ball to become stuck? What fix is needed to avoid getting into this situation? You may optionally try to modify the code to fix it, though this is not required.
A conditional breakpoint can be a godsend when debugging a program that works correctly almost all the time and only rarely hits a bug. Rather than having to first wade through lots of correct operations, the conditional breakpoint lets you zero in on exactly and only the situation that needs attention.
Debugging arrays and memory
The last task is to practice debugging on arrays and memory. Pointers can be a fairly lethal part of the C++ language, as there are many pitfalls you can fall into with harsh consequences. It will take your finest debugging skills to diagnose these woes, so let's do some practicing now.
Changing the display format
You've used the Variables pane to see the values of variables, as well as clicked the triangle to expand an ADT or object to see its internal data. Our next Pro Tip is how to view the contents of an array.
Throughout this whole assignment, we will be working with a struct called DataPoint, which has been defined in the datapoint.h file in the starter code. While there are some extra bells and whistles present in that file that you don't have the fully understand, the baseline struct definition encapsulates two pieces of information, as shown below.
struct DataPoint {
    string name;
    int priority;
}
Given that you will be working with arrays of DataPoint objects throughout this assignment, this debugging exercise will help you build familiarity with inspecting and working with these arrays in the debugger.
Review the code in the test cases of the warmup.cpp file. The first test case demonstrates correct use of an array. Set a breakpoint within the test case and on the statement after the loop has completed initializing the array elements. Run the program under the debugger and select the tests for warmup.cpp.
When the program stops at the breakpoint, look at how the shoppingList variable is displayed in the Variables pane. A C++ array does not track its length, so the debugger does not know how many elements to display for an array. Unless told otherwise, the the debugger assumes the array length is 1 and displays only the first value. To see additional elements beyond the first, you must tell the debugger how many items to display.
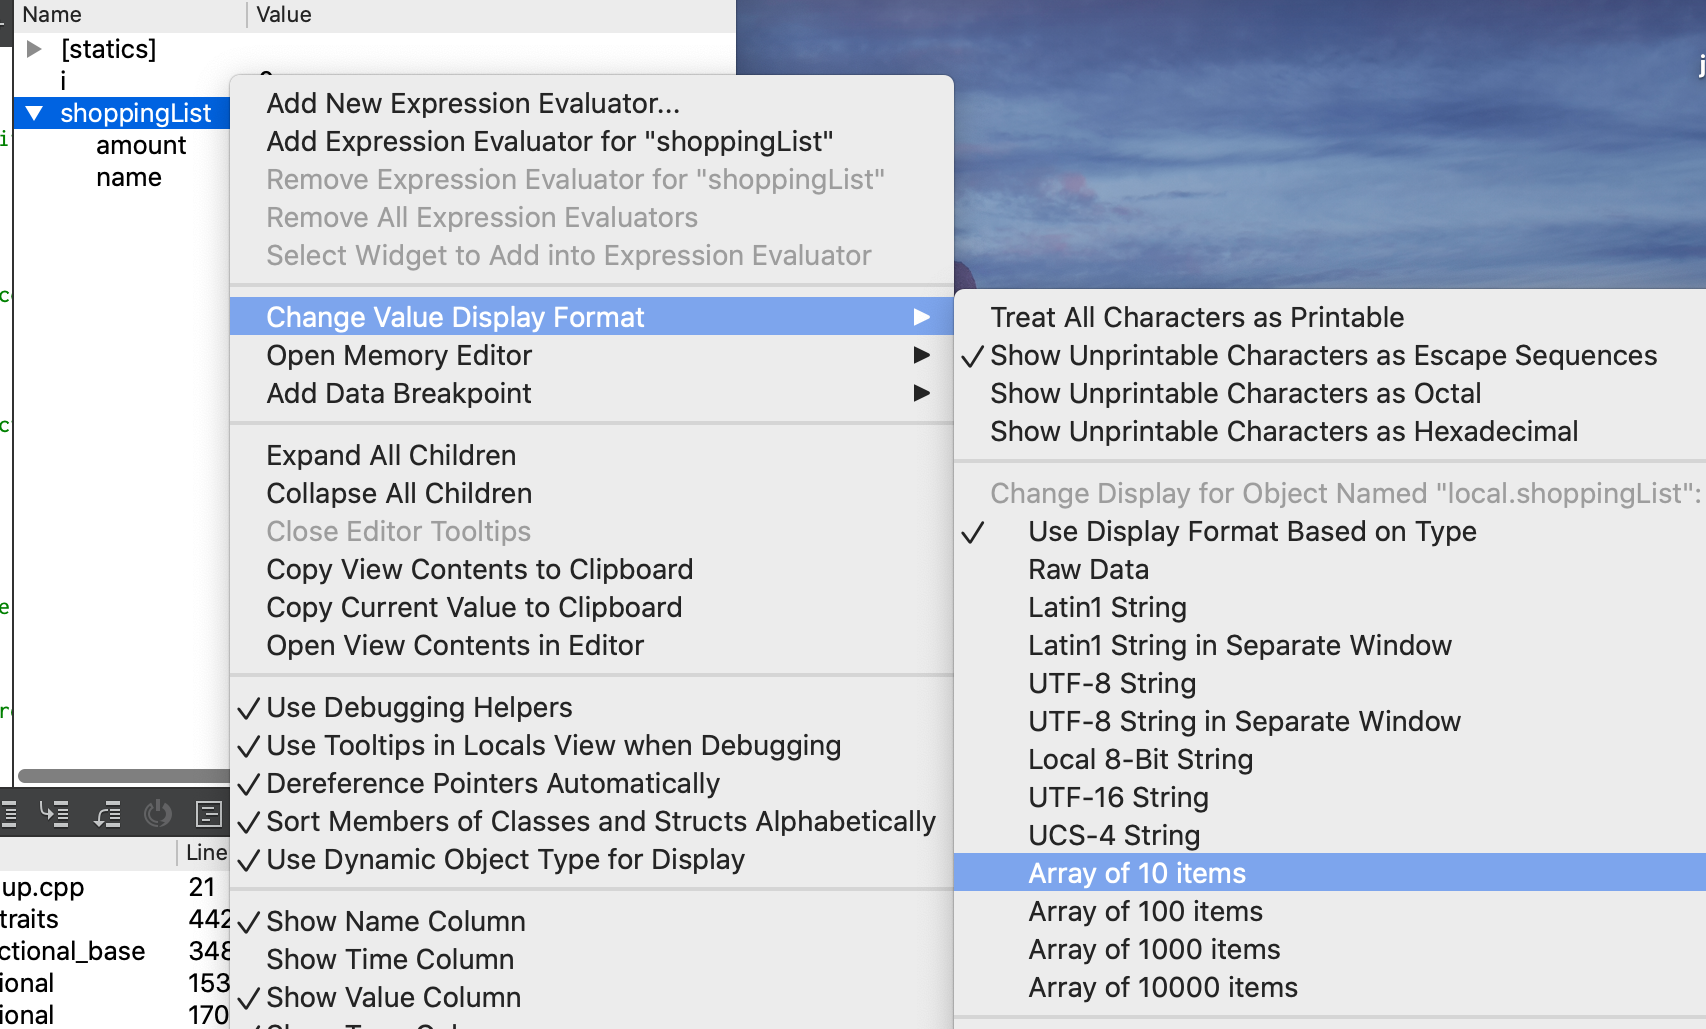
In the Variables pane, control-click the array variable to bring up the pop-up menu and choose "Change Value Display Format". In the submenu, look for the section labeled "Change Display for Object Named …" and select "Array of 10 items" from the options. If the display format doesn't change, make sure you are selecting this option from the top half of the corresponding menu that shows up. There are two identical sets of options and you should be choosing from the set that shows up first.
The options for array length are 10, 100, 1000, and 10000. If your array contains 50 items, you have to choose whether to display only the first 10 or display 100, where the first 50 are valid followed by an additional 50 garbage items.
Examine array memory
Change the display format for shoppingList to an Array of 10 items. The Variables panel adds a triangle to the variable, and if you click to expand, it will display 10 DataPoint structs, indexed by position.
In this code, the array memory was allocated to hold 6 DataPoint structs. The loop initialized the first 3 elements. Examine the values of the elements at index [0],[1] and [2] to see that they are as expected.
The indices [3] [4] and [5] are a valid part of the array memory, but these elements have not been initialized. C++ has set the values according to what it normally does for that type of variable. In particular,
- the strings have all been set to the empty string
- the integers are all essentially random
It also is displaying slots for indices [6] through [9] (because we told the debugger to display 10 elements, remember?), but these slots are beyond the valid range of the array memory. Although the debugger shows the contents of the memory at that location, these contents are even trashier than before; both the integers and the strings are an unpredictable mix of empty, <not accessible>, and random values.
What you see in the debugger parallels what you would observe in an executing program. The value of a variable that has not been initialized is the default value for the type (empty for string or a collection type) or random for the primitive types like int. If your code accesses an index beyond the valid range of the array, you simply get garbage contents. Arrays have no helpful "out of bounds" message to alert you to your mistake. The programmer herself must be vigilant!
Debugging memory mistakes
The warmup.cpp file contains additional test cases that each demonstrate a common error in handling array/memory:
- dereferencing a nullptr address
- accessing memory after it has been deallocated
- deallocating the same memory twice
- deallocating memory using the wrong form of delete operator
Study the code in each test case to understand why the code is in error.
We want you to observe how these errors are going to present themselves. The test cases are currently commented out. Pro tip: To quickly comment a section in or out, select the lines and use "Toggle Comment Section" under the Edit Menu, bound to the hot key Command + /.
Uncomment the first test case (nullptr) and rebuild. Run the program without the debugger.
Whereas ordinary programming errors may cause a program to compute the wrong answer, mis-draw a fractal, or get stuck in a infinite loop, memory errors tend to be much more consequential. This particular error is fatal – the program immediately halts, closes all windows and disappears, leaving behind only a pitiful cry for help in the form of a crash report. Click the "Application Output" tab of the Qt Creator window to see the crash report which will look something like this:
***
*** STANFORD C++ LIBRARY
*** A segmentation fault (SIGSEGV) occurred during program execution.
*** This can happen when you dereference a pointer to an invalid memory address
*** (possibly out of bounds, deallocated, nullptr, or ...).
***
Whenever you encounter a crash, your next move is to run that same code under the debugger.
Rather than exit on fatal error, a crashing program will stop in the debugger at the critical point. This will give you a chance to see where the code was executing at the time of the crash and to poke around and observe the program state. Run the fatal test case under the debugger, and it will stop at the exact line of the bad dereference, allowing you to see that the value of shoppingList is 0x0. (nullptr is the memory address zero).
After you're done exploring a test case, comment it back out. Then uncomment the next test case and try that one.
For each test case, you want to observe what happens without the debugger and again with it. Some memory errors present loud and clear with a distinctive crash; others silently and insidiously do the wrong thing. The very same error can get different results in a different context or when executing on a different operating system. All of this makes debugging memory errors extra hairy.
Take note of how each error is presented on your system so that you can recognize it in the future should you need to diagnose a similar error in your own program.
Answer the following question in short_answer.txt:
- Q4: On your system, what is the observed consequence of each of the three errors?
- access an index outside the allocated array bounds?
- access memory after it has been deallocated?
- deallocate same memory twice?
Note: there is no "right answer" to these questions as there is no single expected behavior for a given memory error. By trying the error, you will see one possible outcome, but the same code in a different program or running on a different computer could behave differently. The only predictable thing about memory errors is their unpredictability! In answering these questions, you are making observations of how the memory error presents on your system and learning what symptoms to look for should you need to diagnose a similar error in your own program.