Lab: Introduction to R
Contents
Lab: Introduction to R#
Basic Commands#
Assigning#
x <- c(1,3,2,5)
x
- 1
- 3
- 2
- 5
Concatenation#
x = c(1,6,2)
x
y = c(1,4,3)
- 1
- 6
- 2
Addition#
length(x)
length(y)
x + y
3
3
- 2
- 10
- 5
Managing namespace#
ls()
rm(x, y)
ls()
- 'x'
- 'y'
It’s also possible to remove all objects at once:
rm(list=ls())
Matrices#
?matrix
x = matrix(data=c(1,2,3,4), nrow=2, ncol=2)
x
| 1 | 3 |
| 2 | 4 |
x = matrix(c(1,2,3,4), 2, 2)
matrix(c(1,2,3,4), 2, 2, byrow=TRUE)
| 1 | 2 |
| 3 | 4 |
sqrt(x)
x^2
| 1.000000 | 1.732051 |
| 1.414214 | 2.000000 |
| 1 | 9 |
| 4 | 16 |
x = rnorm(50)
y = x + rnorm(50, mean=50, sd=.1)
cor(x, y)
0.995246200573129
set.seed(1303)
rnorm(50)
- -1.14397631447974
- 1.34212936561501
- 2.18539047574276
- 0.536392517923731
- 0.0631929664685468
- 0.502234482468979
- -0.000416724686432643
- 0.565819840539162
- -0.572522688962623
- -1.11022500727696
- -0.0486871233624514
- -0.695656217619366
- 0.828917480303335
- 0.206652855081802
- -0.235674509102427
- -0.556310491381104
- -0.364754357080585
- 0.862355034263622
- -0.63077153536771
- 0.313602125215739
- -0.931495317661393
- 0.823867618473952
- 0.523370702077482
- 0.706921411979056
- 0.420204325601679
- -0.269052154682033
- -1.51031729990999
- -0.69021247657504
- -0.143471952443572
- -1.0135274099044
- 1.57327373614751
- 0.0127465054882014
- 0.872647049887217
- 0.422066190530336
- -0.0188157916578866
- 2.61574896890584
- -0.693140174826871
- -0.266321780991085
- -0.720636441231524
- 1.36773420645149
- 0.264007332160512
- 0.632186807367191
- -1.33065098578719
- 0.0268888182209596
- 1.0406363207788
- 1.31202379854711
- -0.0300020766733214
- -0.250025712488174
- 0.0234144856913592
- 1.65987065574227
set.seed(3)
y = rnorm(100)
mean(y)
var(y)
sqrt(var(y))
sd(y)
0.0110355710943715
0.732867501277449
0.856076808047881
0.856076808047881
Graphics#
x = rnorm(100)
y = rnorm(100)
plot(x, y)
plot(x, y, xlab="this is the x-axis",
ylab="this is the y-axis", main="Plot of X vs Y")


Saving figures#
pdf("Figure.pdf")
plot(x, y, col="green")
dev.off()
pdf: 2
x = seq(1,10)
x
x = 1:10
x
x = seq(-pi, pi, length=50)
- 1
- 2
- 3
- 4
- 5
- 6
- 7
- 8
- 9
- 10
- 1
- 2
- 3
- 4
- 5
- 6
- 7
- 8
- 9
- 10
y = x
f = outer(x, y, function(x, y) {cos(y)/(1 + x^2)})
contour(x, y, f)
contour(x, y, f, nlevels=45, add=T)
fa = (f - t(f))/2
contour(x, y, fa, nlevels=15)


image(x, y, fa)
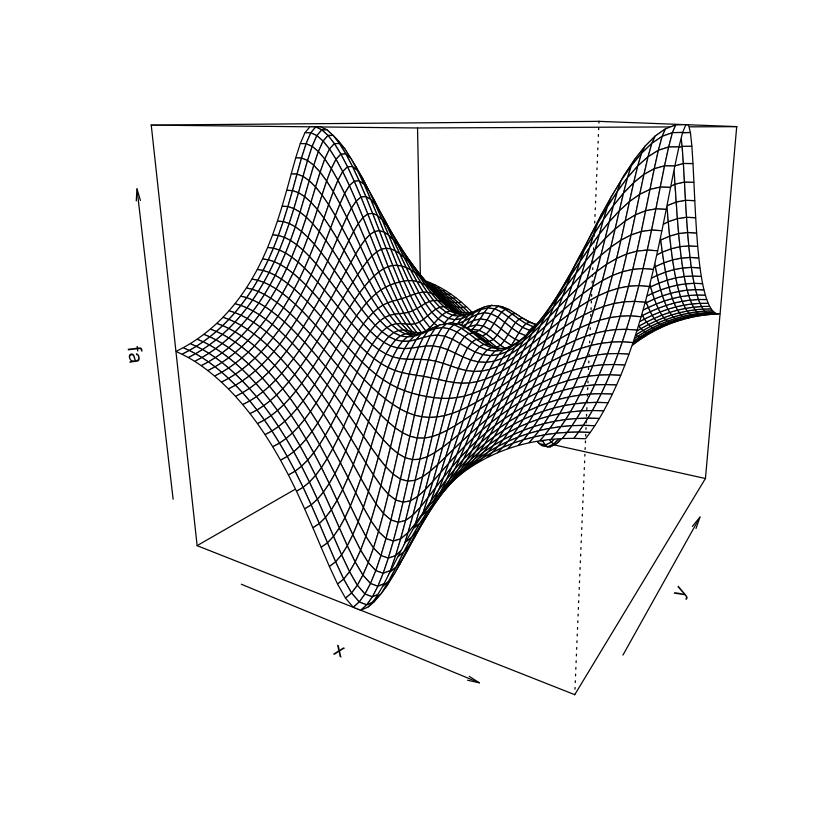
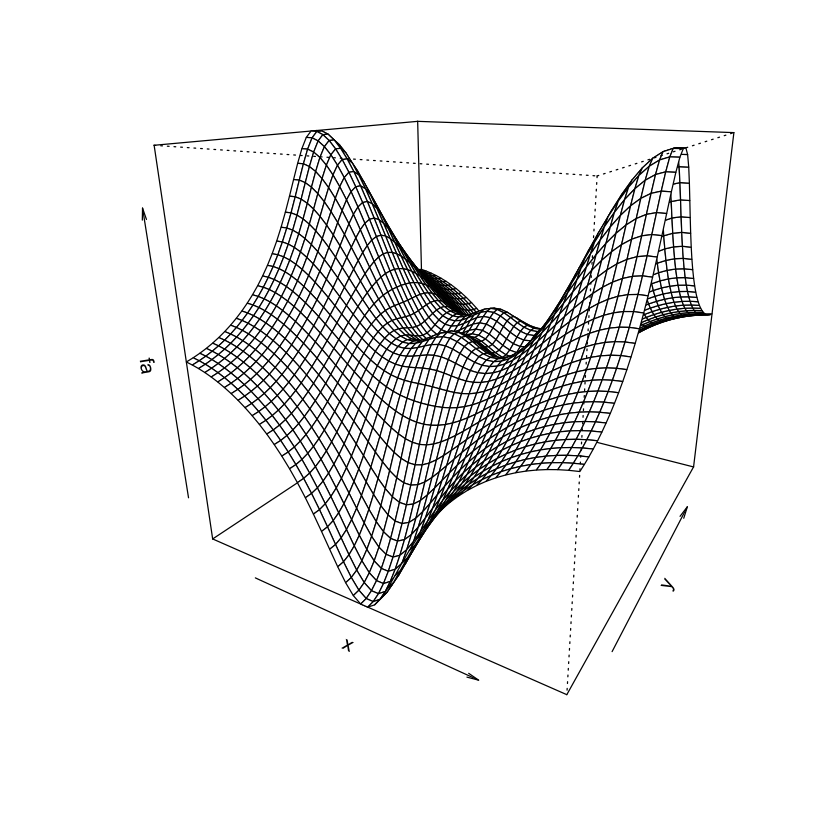
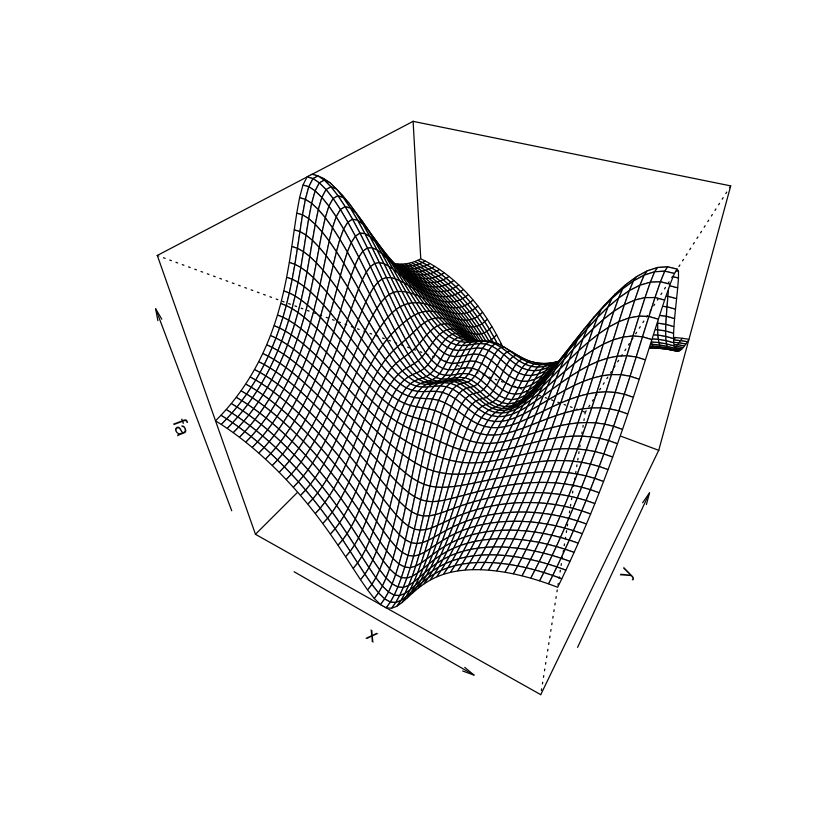
persp(x, y, fa)
persp(x, y, fa, theta=30)
persp(x, y, fa, theta=30, phi=20)
persp(x, y, fa, theta=30, phi=70)
persp(x, y, fa, theta=30, phi=40)


Indexing Data#
A = matrix(1:16, 4, 4)
A[2,3]
10
A[c(1, 3), c(2, 4)]
A[1:3, 2:4]
A[1:2,]
A[,1:2]
A[1,]
- 1
- 5
- 9
- 13
A[-c(1,3),]
A[-c(1,3), -c(1,3,4)]
| 2 | 6 | 10 | 14 |
| 4 | 8 | 12 | 16 |
- 6
- 8
dim(A)
- 4
- 4
Loading Data#
Auto = read.table("Auto.data")
Auto = read.table("Auto.data", header=T, na.strings="?")
Auto = read.csv("Auto.csv", header=T, na.strings="?")
dim(Auto)
Auto[1:4,]
Auto = na.omit(Auto)
dim(Auto)
- 392
- 9
names(Auto)
- 'mpg'
- 'cylinders'
- 'displacement'
- 'horsepower'
- 'weight'
- 'acceleration'
- 'year'
- 'origin'
- 'name'
Additional Graphical and Numerical Summaries#
plot(cylinders, mpg)
Error in plot(cylinders, mpg): object 'cylinders' not found
Traceback:

1. plot(cylinders, mpg)
plot(Auto$cylinders, Auto$mpg)
attach(Auto)
plot(cylinders, mpg)


cylinders = as.factor(cylinders)
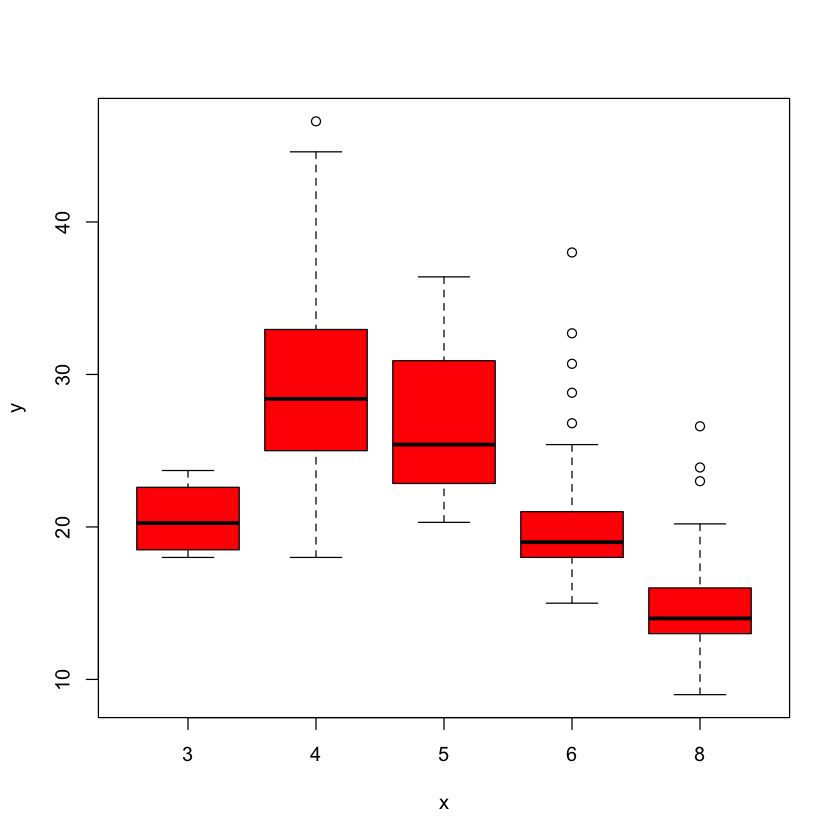
plot(cylinders, mpg)
plot(cylinders, mpg, col="red")
plot(cylinders, mpg, col="red", varwidth=T)
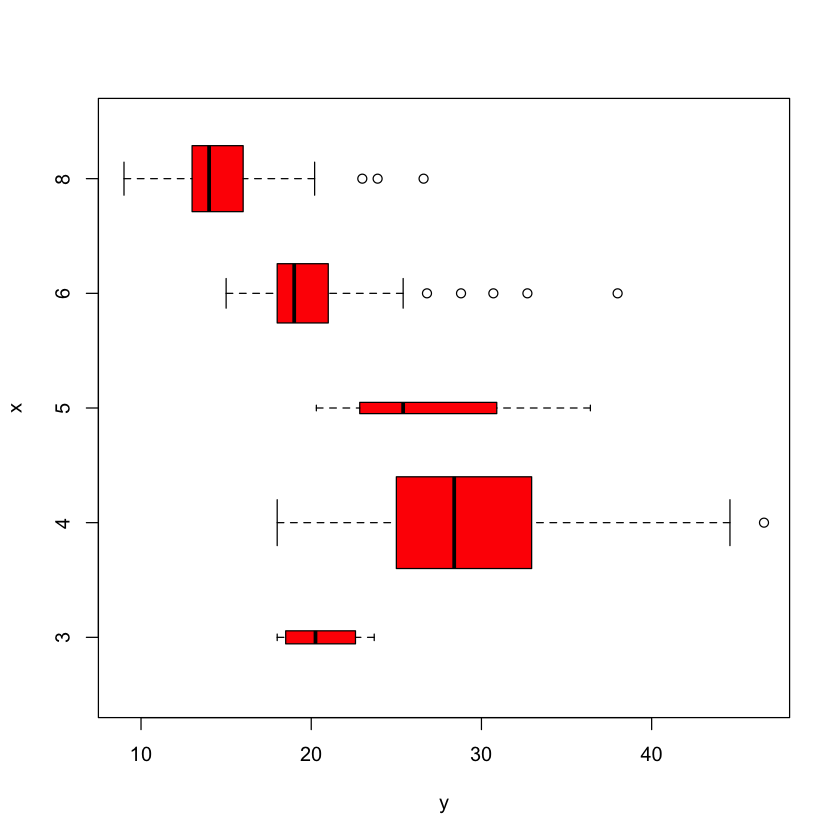
plot(cylinders, mpg, col="red",
varwidth=T, horizontal=T)
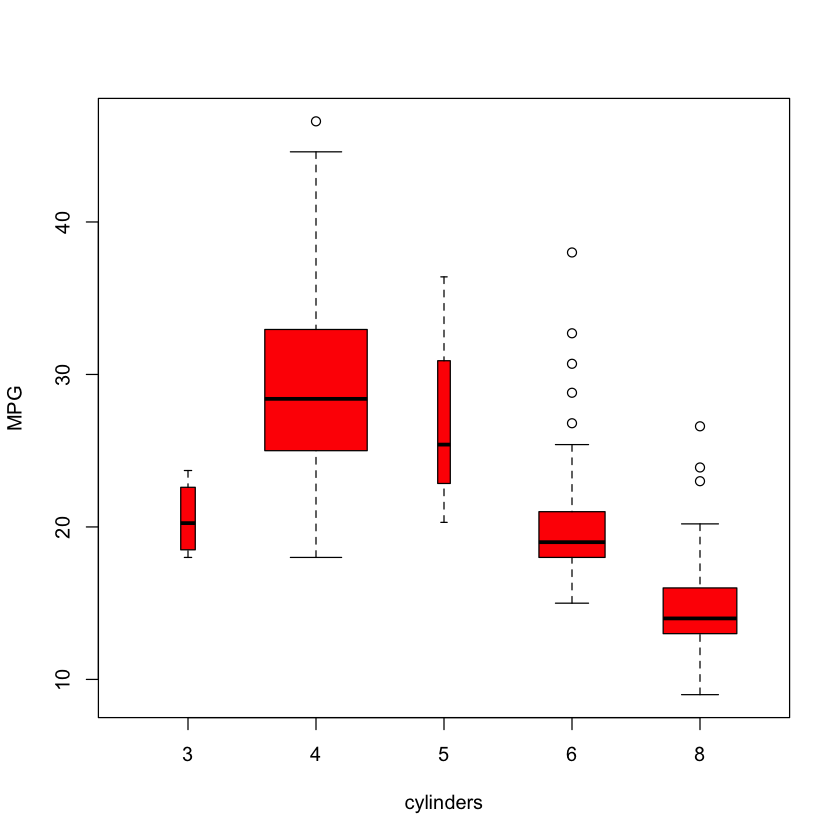
plot(cylinders, mpg, col="red",
varwidth=T, xlab="cylinders", ylab="MPG")


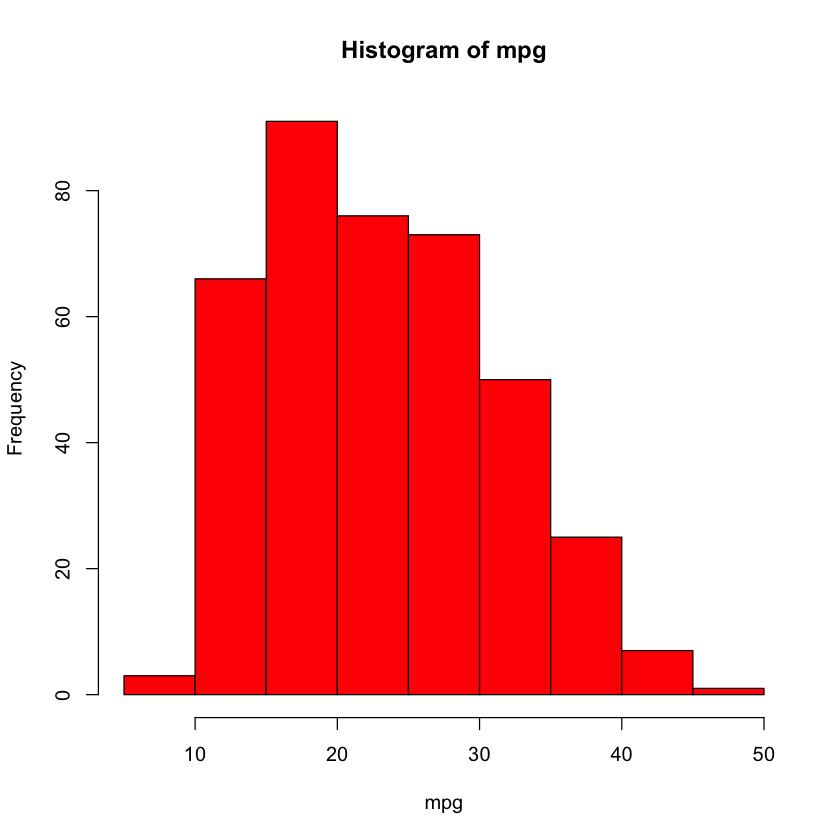
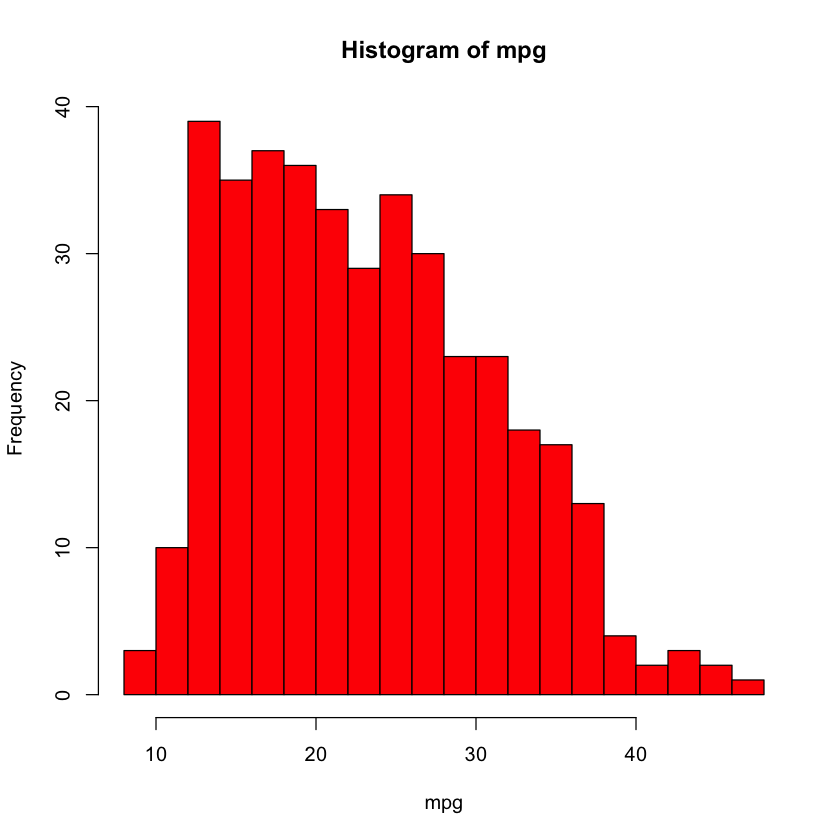
hist(mpg)
hist(mpg, col=2)
hist(mpg, col=2, breaks=15)

pairs(Auto)
pairs(~ mpg + displacement + horsepower + weight + acceleration, Auto)


plot(horsepower, mpg)
identify(horsepower, mpg, name)
summary(Auto)
      mpg          cylinders      displacement     horsepower        weight
 Min.   : 9.00   Min.   :3.000   Min.   : 68.0   Min.   : 46.0   Min.   :1613
 1st Qu.:17.00   1st Qu.:4.000   1st Qu.:105.0   1st Qu.: 75.0   1st Qu.:2225
 Median :22.75   Median :4.000   Median :151.0   Median : 93.5   Median :2804
 Mean   :23.45   Mean   :5.472   Mean   :194.4   Mean   :104.5   Mean   :2978
 3rd Qu.:29.00   3rd Qu.:8.000   3rd Qu.:275.8   3rd Qu.:126.0   3rd Qu.:3615
 Max.   :46.60   Max.   :8.000   Max.   :455.0   Max.   :230.0   Max.   :5140

  acceleration        year           origin                      name
 Min.   : 8.00   Min.   :70.00   Min.   :1.000   amc matador       :  5
 1st Qu.:13.78   1st Qu.:73.00   1st Qu.:1.000   ford pinto        :  5
 Median :15.50   Median :76.00   Median :1.000   toyota corolla    :  5
 Mean   :15.54   Mean   :75.98   Mean   :1.577   amc gremlin       :  4
 3rd Qu.:17.02   3rd Qu.:79.00   3rd Qu.:2.000   amc hornet        :  4
 Max.   :24.80   Max.   :82.00   Max.   :3.000   chevrolet chevette:  4
                                                 (Other)           :365
summary(mpg)
   Min. 1st Qu.  Median    Mean 3rd Qu.    Max.
   9.00   17.00   22.75   23.45   29.00   46.60