Tree-based methods
Contents
Tree-based methods#

|
|
Tree-based methods#
Regression trees#
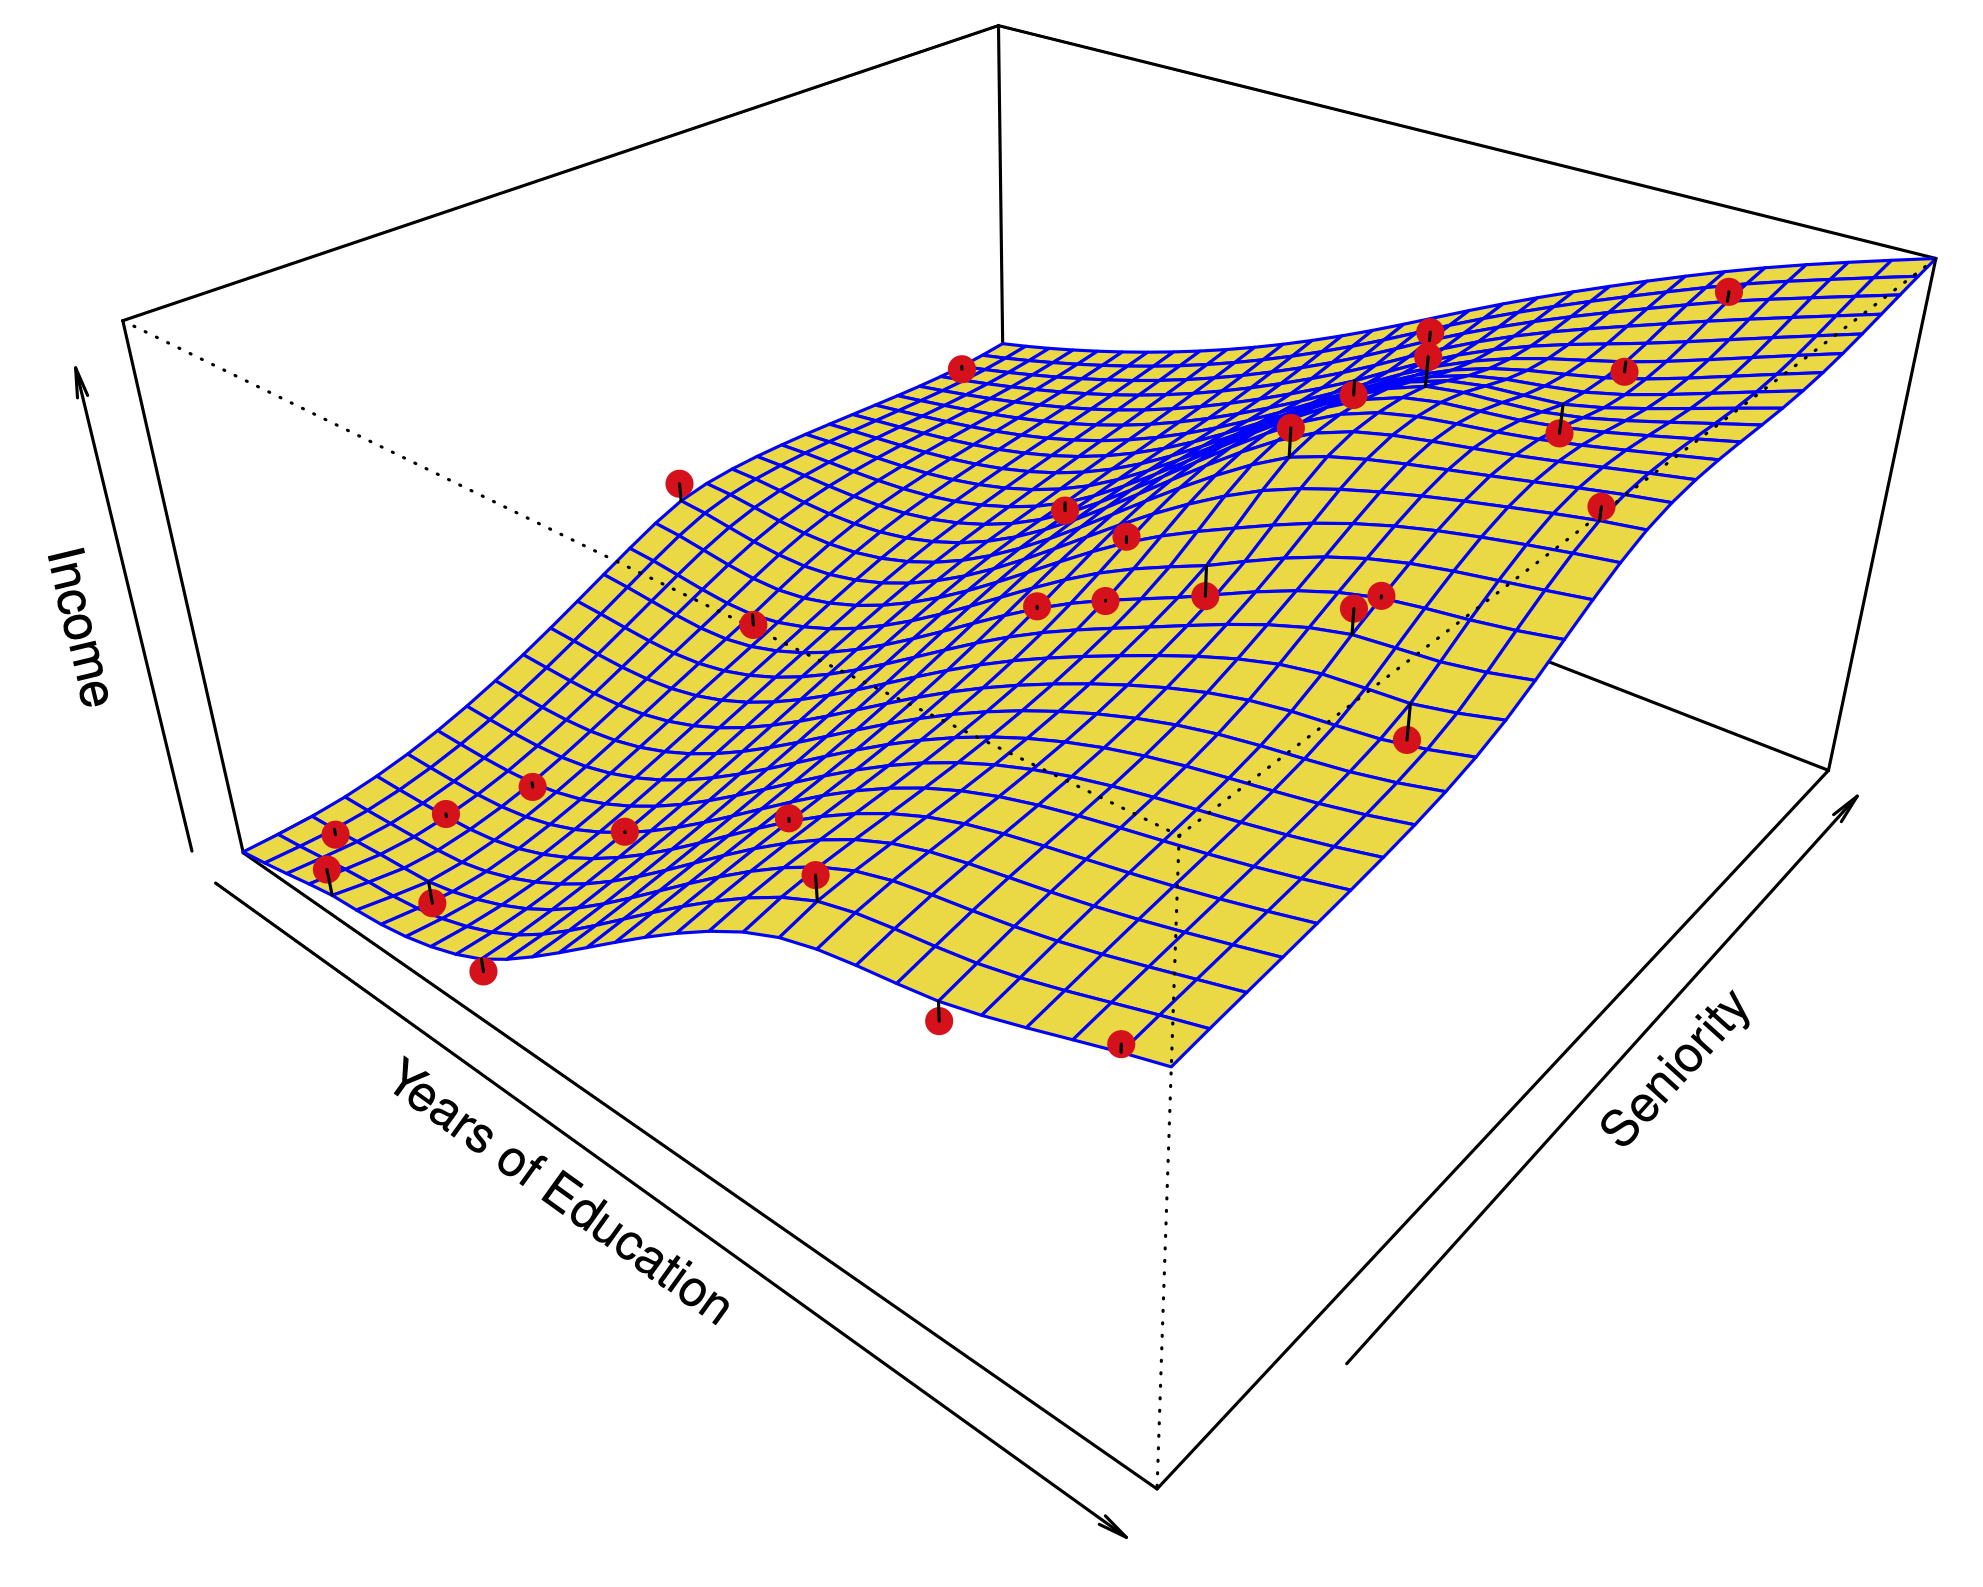
Example: Predicting a baseball player’s salary#

|

|
The prediction for a point in \(R_i\) is the average of the training points in \(R_i\).
Tree-based methods#
Regression trees#
How is a regression tree built?#
- Start with a single region $R_1$, and iterate:
- Select a region $R_k$, a predictor $X_j$, and a splitting point $s$, such that splitting $R_k$ with the criterion $X_j
- Select a region $R_k$, a predictor $X_j$, and a splitting point $s$, such that splitting $R_k$ with the criterion $X_j
- Terminate when there are, say, 5 observations or fewer in each region.
- This grows the tree from the root towards the leaves.
Tree-based methods#
Regression trees#
How is a regression tree built?#

Tree-based methods#
Regression trees#
How do we control overfitting?#
- **Idea 1:** Find the optimal subtree by cross validation.
- Hmm.... there are too many possibilities -- harder than best subsets!
- **Idea 2:** Stop growing the tree when the RSS doesn't drop by more than a threshold with any new cut.
- Hmm... in our greedy algorithm, it is possible to find good cuts after bad ones.
Tree-based methods#
Regression trees#
How do we control overfitting?#
Solution: Prune a large tree from the leaves to the root.
- **Weakest link pruning:**
- Starting with $T_0$, substitute a subtree with a leaf to obtain $T_1$, by minimizing: $$\frac{RSS(T_1)-RSS(T_0)}{|T_0|- |T_1|}.$$
- Iterate this pruning to obtain a sequence $T_0,T_1,T_2,\dots,T_m$ where $T_m$ is the null tree.
- The sequence of trees can be used to solve the minimization for **cost complexity pruning** (over subtrees $T \subset T_0$) $$ \text{minimize}_T \left(\sum_{m=1}^T \sum_{x_i \in R_m}(y_i - \hat{y}_{R_m})^2 + \alpha |T|\right) $$
- Choose $\alpha$ by cross validation.
Tree-based methods#
Regression trees#
Predicting baseball salaries#
| **Unpruned tree** | **Error rates** |
|
|

|
Tree-based methods#
Regression trees#
Predicting baseball salaries#
| **Optimal tree** | **Error rates** |
|
|
|
Tree-based methods#
Classification trees#
- They work much like regression trees. Both are examples of *decision trees*.
- We predict the response by **majority vote**, i.e. pick the most common class in every region.
- Instead of trying to minimize the RSS: $$\cancel{\sum_{m=1}^{|T|} \sum_{x_i\in R_m} (y_i-\bar y_{R_m})^2}$$ we minimize a classification loss function.
Tree-based methods#
Classification trees#
Classification losses#
- The 0-1 loss or misclassification rate: $$\sum_{m=1}^{|T|} \sum_{x_i\in R_m} \mathbf{1}(y_i \neq \hat y_{R_m})$$
- The Gini index: $$\sum_{m=1}^{|T|} q_m \sum_{k=1}^K \hat p_{mk}(1-\hat p_{mk}),$$ where $\hat p_{m,k}$ is the proportion of class $k$ within $R_m$, and $q_m$ is the proportion of samples in $R_m$.
- The cross-entropy: $$- \sum_{m=1}^{|T|} q_m \sum_{k=1}^K \hat p_{mk}\log(\hat p_{mk}).$$
- The Gini index and cross-entropy are better measures of the purity of a region, i.e. they are low when the region is mostly one category.
- **Motivation for the Gini index:** If instead of predicting the most likely class, we predict a random sample from the distribution $(\hat p_{1,m},\hat p_{2,m},\dots,\hat p_{K,m})$, the Gini index is the expected misclassification rate.
- It is typical to use the Gini index or cross-entropy for growing the tree, while using the misclassification rate when pruning the tree.
Heart dataset#

Tree-based methods#
Decision trees#
How do we deal with categorical predictors?#
- If there are only 2 categories, then the split is obvious. We don't have to choose the splitting point $s$, as for a numerical variable.
- If there are more than 2 categories:
- Order the categories according to the average of the response: $$\mathtt{ChestPain:a} > \mathtt{ChestPain:c} > \mathtt{ChestPain:b}$$
- Treat as a numerical variable with this ordering, and choose a splitting point $s$.
- One can show that this is the optimal way of partitioning.
Tree-based methods#
Decision trees#
How do we deal with missing data?#
- Suppose we can assign every sample to a leaf $R_i$ despite the missing data.
- When choosing a new split with variable $X_j$ (growing the tree):\\
- Only consider the samples which have the variable $X_j$.
- In addition to choosing the best split, choose a second best split using a different variable, and a third best, ...
- To propagate a sample down the tree, if it is missing a variable to make a decision, try the second best decision, or the third best: **surrogate splitting**
Tree-based methods#
Decision trees#
Some advantages#
- Very easy to interpret!
- Closer to human decision-making.
- Easy to visualize graphically (for shallow ones)
- They easily handle qualitative predictors and missing data.
Downside: they don’t necessarily fit that well!
Tree-based methods#
Bagging#
- Bagging = Bootstrap Aggregating
- In the Bootstrap, we replicate our dataset by sampling with replacement:
- Original dataset: `x=c(x1, x2, ..., x100)`
- Bootstrap samples: `boot1=sample(x, 100, replace=True)`, ..., `bootB=sample(x, 100, replace=True)`
- We used these samples to get the Standard Error of a parameter estimate: $$\text{SE}(\hat\beta_1) \approx \frac{1}{B}\sum_{b=1}^B \hat\beta_1^{(b)}$$
Tree-based methods#
Bagging#
- In **bagging** we average the predictions of a model fit to many Bootstrap samples.
- *Example.* Bagging the Lasso
- Let $\hat y^{L,b}$ be the prediction of the Lasso applied to the $b$th bootstrap sample.
- Bagging prediction: $$\hat y^\text{bag} = \frac{1}{B} \sum_{b=1}^B \hat y^{L,b}.$$
Tree-based methods#
Bagging#
When does Bagging make sense?#
When a regression method or a classifier has a tendency to overfit, bagging reduces the variance of the prediction.
- When $n$ is large, the empirical distribution is similar to the true distribution of the samples.
- Bootstrap samples are similar to independent realizations of the data. They are actually conditionally independent, given the data.
- Bagging smooths out an estimator which can reduce variance.
Tree-based methods#
Bagging#
Bagging decision trees#
- **Disadvantage:** Every time we fit a decision tree to a Bootstrap sample, we get a different tree $T^b$.\\[2mm]
- $\to$ Loss of interpretability
- **Variable importance:**
- For each predictor, add up the total amount by which the RSS (or Gini index) decreases every time we use the predictor in $T^b$.
- Average this total over each Boostrap estimate $T^1,\dots,T^B$.

Tree-based methods#
Bagging#
Out-of-bag (OOB) error#
- To estimate the test error of a bagging estimate, we could use cross-validation.
- Each time we draw a Bootstrap sample, we only use ~63% of the observations.
- **Idea:** use the rest of the observations as a test set.
- **OOB error:**
- For each sample $x_i$, find the prediction $\hat y_{i}^b$ for all bootstrap samples $b$ which do not contain $x_i$. There should be around $0.37B$ of them. Average these predictions to obtain $\hat y_{i}^\text{oob}$.
- Compute the error $(y_i-\hat y_{i}^\text{oob})^2$.
- Average the errors over all observations $i=1,\dots,n$.
Tree-based methods#
Bagging#
Out-of-bag (OOB) error#

The test error decreases as we increase \(B\) (dashed line is the error for a plain decision tree).
Tree-based methods#
Bagging#
Random Forests#
- Bagging has a problem: $\to$ The trees produced by different Bootstrap samples can be very similar
- **Random Forests**:
- We fit a decision tree to different Bootstrap samples.
- When growing the tree, we select a random sample of $m
- Finally, average the prediction of each tree.
Tree-based methods#
Bagging#
Random Forests vs. Bagging#
Tree-based methods#
Bagging#
Random Forests, choosing \(m\)#

The optimal \(m\) is usually around \(\sqrt p\), but this can be used as a tuning parameter.
Tree-based methods#
Boosting#
Another ensemble method (i.e. uses a collection of learners)
Instead of randomizing each learner, each learner fits to the residual (not that unlike backfitting)
Boosting regression trees#
- Set $\hat f(x) = 0$, and $r_i=y_i$ for $i=1,\dots,n$.
- For $b=1,\dots,B$, iterate:
- Fit a regression tree $\hat f^b$ with $d$ splits to the response $r_1,\dots,r_n$.
- Update the prediction to: $$\hat f(x) \leftarrow \hat f(x) + \lambda \hat f^b(x).$$
- Update the residuals, $$ r_i \leftarrow r_i - \lambda \hat f^b(x_i).$$
- Output the final model: $$\hat f(x) = \sum_{b=1}^B \lambda \hat f^b(x).$$
Boosting classification trees#
Can be done with appropriately defined residual for classification based on offset in log-odds.
Tree-based methods#
Boosting#
Some intuition#
Boosting learns slowly
We first use the samples that are easiest to predict, then slowly down weigh these cases, moving on to harder samples.
\end{frame}
Tree-based methods#
Boosting vs. random forests#
Random Forests, choosing \(m\)#

The parameter \(\lambda=0.01\) in each case.
We can tune the model by CV using \(\lambda, d, B.\)