Lecture 1: Welcome to Statistics!#
Stanford University Spring 2026
Instructors: Michael Howes and Tselil Schramm
Today:
Why study statistics?
Syllabus + what to expect
What is statistics?#
Statistics: the science of drawing conclusions from data.
Statistics tells us how to
Put numbers in context
economics, politics, business, funding/resource allocation, global health
Gather new information:
experimental design in medicine, natural and social sciences, marketing, engineering
Make accurate predictions
weather, political forecasting, autocorrect, AI models
Statistics: Putting numbers in context#
How should we interpret observed data?
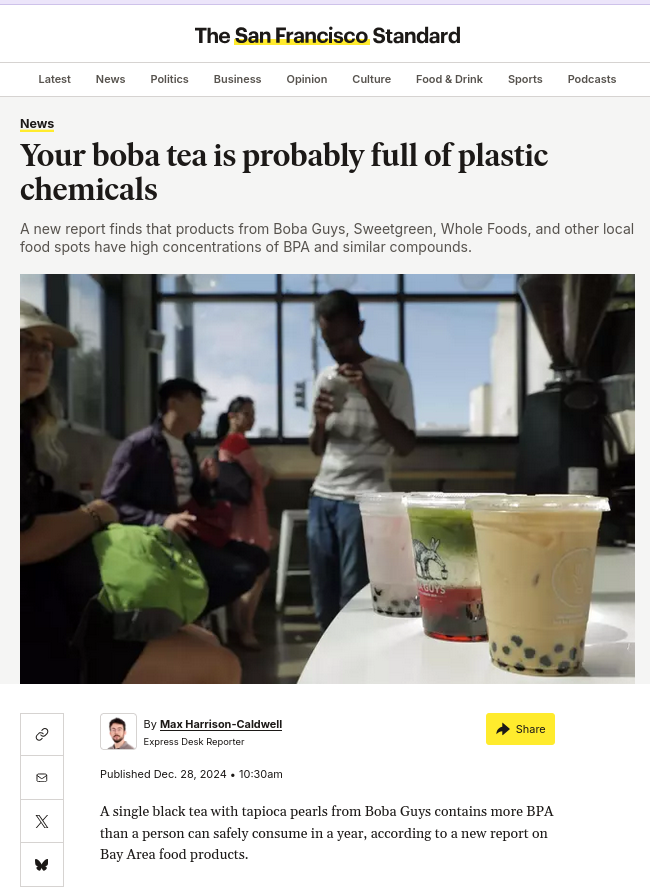
Example 1: Boba Guys and microplastics#
A recent study measured dangerously high levels of BPA microplastics in drinks from the Palo Alto Boba Guys!
As reported in the San Francisco Standard and the San Francisco Chronicle.
Why do Boba Guys drinks contain so much plastic?#
Theory 1: the plastic from the cup leeches into the drink.
Is there a simpler explanation? Is the high level of plastic really explained by the plastic cups?
The “Null” hypothesis#
An important idea in statistics:
If your observations appear to support a theory, stop and ask:
Maybe this observation just occurred randomly?
Is it convincing evidence for my theory?
We call the theory that the observation occurred randomly the “Null Hypothesis.”
Boba Guys Null Hypothesis#
A second look at the Boba Guys story
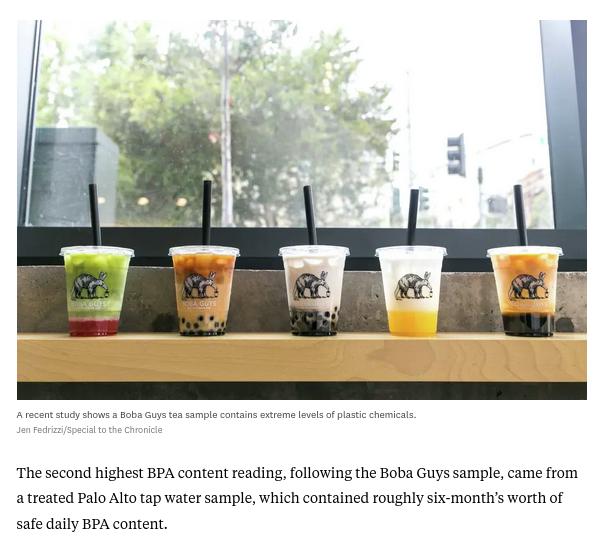
Theory 2: the **tap water** used to make the drinks already has a high concenration of microplastics!
The plastic cup probably does not have a large influence.
Tea is made by boiling water
Boba is made by boiling water, sugar and tapioca balls down into a syrup
Boiling water increases the concentration of the stuff dissolved in it
Warning! The fact that the tapwater had a very high concentration of microplastics was not emphasized in the articles!
Not in the headlines or subheadline
Mentioned in passing more than halfway through the articles themselves
Example 2: The Madden Cover Jinx#
After a player appears on the cover of Madden or Sports Illustrated, their perfomance often declines. Here is one of many examples.
In 2010, Peyton Hillis had an amazing season on the Cleveland Browns (source):
- 1,177 rushing yards
- 11 touchdowns
He appears on the cover of Madden in 2011.

The following season, he is way worse:
587 rushing yards
3 touchdowns
Theory 1: Peyton was jinxed! He appeared on the cover of Madden, and then his 2011 season was much worse than his 2010 season.
(See here for coverage of this theory in the news.)
Regression to the mean#
Take a look at Peyton’s numbers in 2009:
183 rushing yards
1 touchdown

Theory 2: Peyton’s 2010 season was an outlier. His performance in 2011 is more representative of his typical abilities.
This idea is called “regression to the mean:” if you observe an extreme measurement, the next measurement will likely be closer to a typical measurement.
Here, the null hypothesis is that Peyton is just OK at football (relative to an NFL player) and that 2011 was an outlier year.
Statistics: Gathering new information#
How should we design experiments to answer tough questions?
Classic Example: Salk polio vaccine trial.#
Through the 1950’s, Polio was one of the most feared childhood diseases in the U.S.
The disease was pretty rare, affecting about 50 in 100,000 (comparison: on average, 2 / 4,000 Stanford undergrads would have had the disease).
The disease struck hardest in wealthy areas with good sanitation.
The disease was also unpredictable; different cities experienced waves on different scales from year to year.
If a kid got sick, the outcomes could be really bad: a reasonable fraction were paralyzed for life, and some even died.
How should we run a vaccine trial?#
In the early 1950’s, Jonas Salk develops a vaccine. The vaccine is an inactive vaccine: it is made of Polio virus that has been killed with formaldehyde.
Pros of an inactive vaccine: less likely to cause infection
Cons of an inactive vaccine: less likely to cause immunity
To determine whether the vaccine was effective, statisticians and doctors had to design a trial.
What are some challenges in designing such a trial? How would you go about it?
Salk polio vaccine trial#
The Salk polio vaccine trial took place in 1955. There were two experiments: one observational study and one randomized double blind.
Randomized double blind study#
Group |
Size |
Rate |
|---|---|---|
Treatment |
200,000 |
28 / 100,000 |
Control |
200,000 |
71 / 100,000 |
No Consent |
350,000 |
46 / 100,000 |
Observational study#
Group |
Size |
Rate |
|---|---|---|
Grade 2 (vaccine) |
225,000 |
25 / 100,000 |
Grades 1 and 3 (control) |
725,000 |
54 / 100,000 |
No Consent |
125,000 |
44 / 100,000 |
How strong is the evidence in the double blind study?
Statistics gives an answer! Theory suggests that there’s a \(\ge 90\%\) chance that the double-blind experiment rates are within \(20\%\) of the “true” rates.
How does the observational study compare to the double blind experiment?
Statistical thinking suggests sample bias could be a problem in the observational study.
Example: A/B testing for development#
A/B testing is used widely in business and in politics to determine what the consumers/voters prefer.
Scenario: you have two options, A or B, for how to advertise/design a product.
Example: should the homepage of the Obama campaign use the word “sign up” or “learn more” for the mailing list link?
Idea: run an experiment.
Each user is randomly assigned into group A or B (and then given product A or B).
See if option A or B generates a more favorable response.
There are many famous stories about how decisions made through A/B testing dramatically increased revenue/engagement.
For example, the 2008 Obama campaign used A/B testing extenstively. The “learn more” vs. “sign up” button + a photo tweak increased mailing list sign ups 40%.
Microsoft Bing A/B tested the perfect shade of blue for links, leading to increased user engagement and tens of millions in increased annual revenue.
Have you yourself experienced A/B testing? E.g. you notice you have access to a different app feature than your friends.
Statistics: Making accurate predictions#
Statistics in sports#
“Moneyball”: baseball teams used to choose draft picks based on vibes.
Starting around 2001, the Oakland A’s started picking players based on stats.


Now, everyone does this.
Statistics and data in designing AI models#
An old idea in statistics is to use data to “train a model.”
This means you find patterns in the data, and use them to make predictions.
The simplest example is a linear regression.

Modern AI models#
Modern AI models are nothing but (more sophisticated) statistical models, fit to a mind-blowing amount of data. ^[Caveat: statistical principles are used to engineer AI models. But we still lack statistical tools for quantifying legitimacy of AI-found patterns. This is a frontier of statistical research!]
Image source: NVIDIA
Starting in early 2010’s, advances in computing power and model design have taken this pattern finding to an astounding level.
Relatedly, generative AI is, at its core, an example of the classic statistical problem of “density estimation” or “sample generation.”
Mistakes and Misuses of Statistics#
Statistics is a set of tools, whose validity is based on logic and mathematical modeling.
Applied properly, Statistics lets us draw useful conclusions from data.
Applied incorrectly, it can cause us to draw incorrect conclusions from data!
Like any tool, it’s dangerous to blindly trust statistics!
Classic Mistake: the prosecutor’s fallacy#
-
In 1995, retired football star O.J. Simpson stood trial for the murder of his ex-wife.
The prosecution presented evidence that O.J. had been violent towards his wife during their marriage. In defense, O.J.’s lawyers used the following argument:
”Less than 1 in 2500 women who is domestically abused by her spouse is later murdered by her spouse.”
What is more relevant is the following fact:
”8 out of 9 domestically abused women who are murdered are murdered by their spouse.”
The prosecution’s argument is a misapplication of probabilistic logic. Most women who are abused by their spouse are not murdered, but most abused women who are murdered are murdered by their spouse.
Similar issues occur in testing for rare diseases.
If you get tested for a disease which occurs in \(\le 1\%\) of the population using a test that is \(99\%\) accurate, there is a \(\ge 50\%\) chance that a positive result is a false positive!
Mistake: spurious correlations and p-hacking#
The scientific method demands that we first make a hypothesis, then collect data, and only then decide whether to reject the hypothesis.
If we collect data first, and look for patterns afterwards, we risk drawing false conclusions. For example,

Source: Tyler Vigen
Imagine you are a scientist, and you have been collecting data in your lab during an experiment that lasts several months. Your data does not allow you to confidently reject your original hypothesis. What are statistically sound ways to analyze your data?
A misunderstanding of the statistical underpinnings can lead to accidental “p-hacking.”
Mistake: sample bias#
Polling, especially on controversial issues, is tricky.
If you collect a non-uniform sample, your answer can be systematically skewed!

The same phenomenon occurs when you are trying to estimate any quantity, e.g. average income, average height, effectiveness of a medication, danger of a sport.
Empowerment through learning!#
The main goal of this class is to empower you with the basics of statistics and statistical thinking. We want you to:
Understand numerical and statistical concepts for yourself, from first principles.
Use statistics and statistical methods to make decisions and predictions from data.
Recognize common misuses of statistics.
Topics roadmap#
Topic 1: Thinking about scale#
Numbers are only meaningful in context.
Topics: Key questions to put numbers in context. Thinking about scale: comparisons, ballpark estimates, cost-benefit analysis.
Topic 2: Exploratory data analysis#
What is data?
How should we visualize, organize, and summarize data?
Topics: Fundamental summary statistics (averages, variability, correlation), data visualization
Topic 3: Probability#
A mathematical tool for reasoning about uncertainty.
The core logic that powers statistics
Topics: Coincidences, Bayes’ rule and conditioning, false positives in testing, decision making in the face of uncertainty
Topic 4: Estimates, Hypothesis Testing, and Experiments#
Drawing reliable conclusions from data
Reliability of measurements from experiments and polls
Principles of experiments. Fundamentals of experimental design.
Topics: sampling and sample bias, polls, confidence intervals, hypothesis tests and p-values, correlation vs. causation
Topic 5: Machine learning#
What are ML models? How do they work (and can we trust them)?
Topics: regression, model “training,” expressiveness of models
Three themes#
Insight from simple models.
The world is complicated. Answering questions exactly is overwhelming and often impossible. A simplified model empowers us to answer questions precisely.
Sample bias (“conditioning”) really matters!
If the data we observe is collected in a biased way, our conclusions may be way off.
Critical thinking is essential.
Quantitative, precise answers feel good.
Once we specify a model, statistics gives precise answers.
But is our model good? Does it fit our situation?
Think critically! Don’t calculate blindly!
What to expect from this class#
Course philosophy#
The emphasis on this class will be on fundamental concepts and statistical thinking; we want you to feel enfranchised to think about data and statistics from first principles.
Formulas and memorization will be kept to a minimum.
If we had to choose between you thinking critically vs. calculating accurately, we would choose thinking critically every. single. time.
Computers can do many calculations for you.
We will not teach you how to program in R. We’ll try to teach you to vibecode.
Our guess is that in 5-10 years, most programming in this domain will be done by AI, so it is more important for you to be able to ask for the program you want.
Logistics#
Lectures: M,W,F. Each lecture includes an extra credit worksheet that you can hand in at the end of class.
Discussion section: Th. Discussion activities and a chance for review/practice problems.
Practice Problems: Each week, we will post optional practice problems and practice quizzes for you to do at home. They’ll be reviewed in section.
Readings: Each week there will be some reading (or watching/listening), meant to reinforce the concepts we see in class. There is no official course textbook. All lecture content will be posted online.
Quizzes: Every week on Friday, in-person. Study as you go! A practice quiz will be made available each Monday.
Final: IN PERSON on June 8, 2026.
See the Syllabus for more details.