Discussion 2: Data visualization and vibecoding#
STATS 60 / STATS 160 / PSYCH 10
Today’s section
Recap of lecture material.
Week 2 practice quiz 1.
Making visualizations with vibecoding.
Recap#
Data terminology#
Observational units are the individual entities on which data are recorded.
Variables are the different characteristics/measurements that are recorded for each observational unit.
Variables can be quantitative (like height) or categorical (like eye color).
The distribution of a variable describes the pattern of the variable across the different observational units.
The distribution can be represented with a visualization or with summary statistics (like the mean).
Visualizations#
When making a visualization, think about the number of variables and the type of variable (quantitative or categorical).
For a single variable:
Categorical: bar chart or pie chart.
Quantitative: histogram.
For multiple variables:
Two categorical: stacked bar chart.
Two quantitative: scatter plot.
One quantitative, one categorical: side-by-side histograms.
For a variable that changes over time: line chart.
For a variable that changes over locations: dot map or chloropelth (maps)
Practice quiz 1#
Bird nests and cigarette butts#
Practice quiz #1 is about a 2013 study that found that bird nests that contained cigarette butts typically contained fewer parasites. This was done by measuring the number of parasites and the weight of cigarette butts in different bird nests.


Bird nests and cigarette butts#
What are the observational units?
What variables will be relevant for the study?
The observational units are bird nests.
Relevant variables are:
Number of cigarette butts.
Number of nest parasites.
Weight of cigarette butts.
Species of bird.
and more!
Bird nests and cigarette butts#
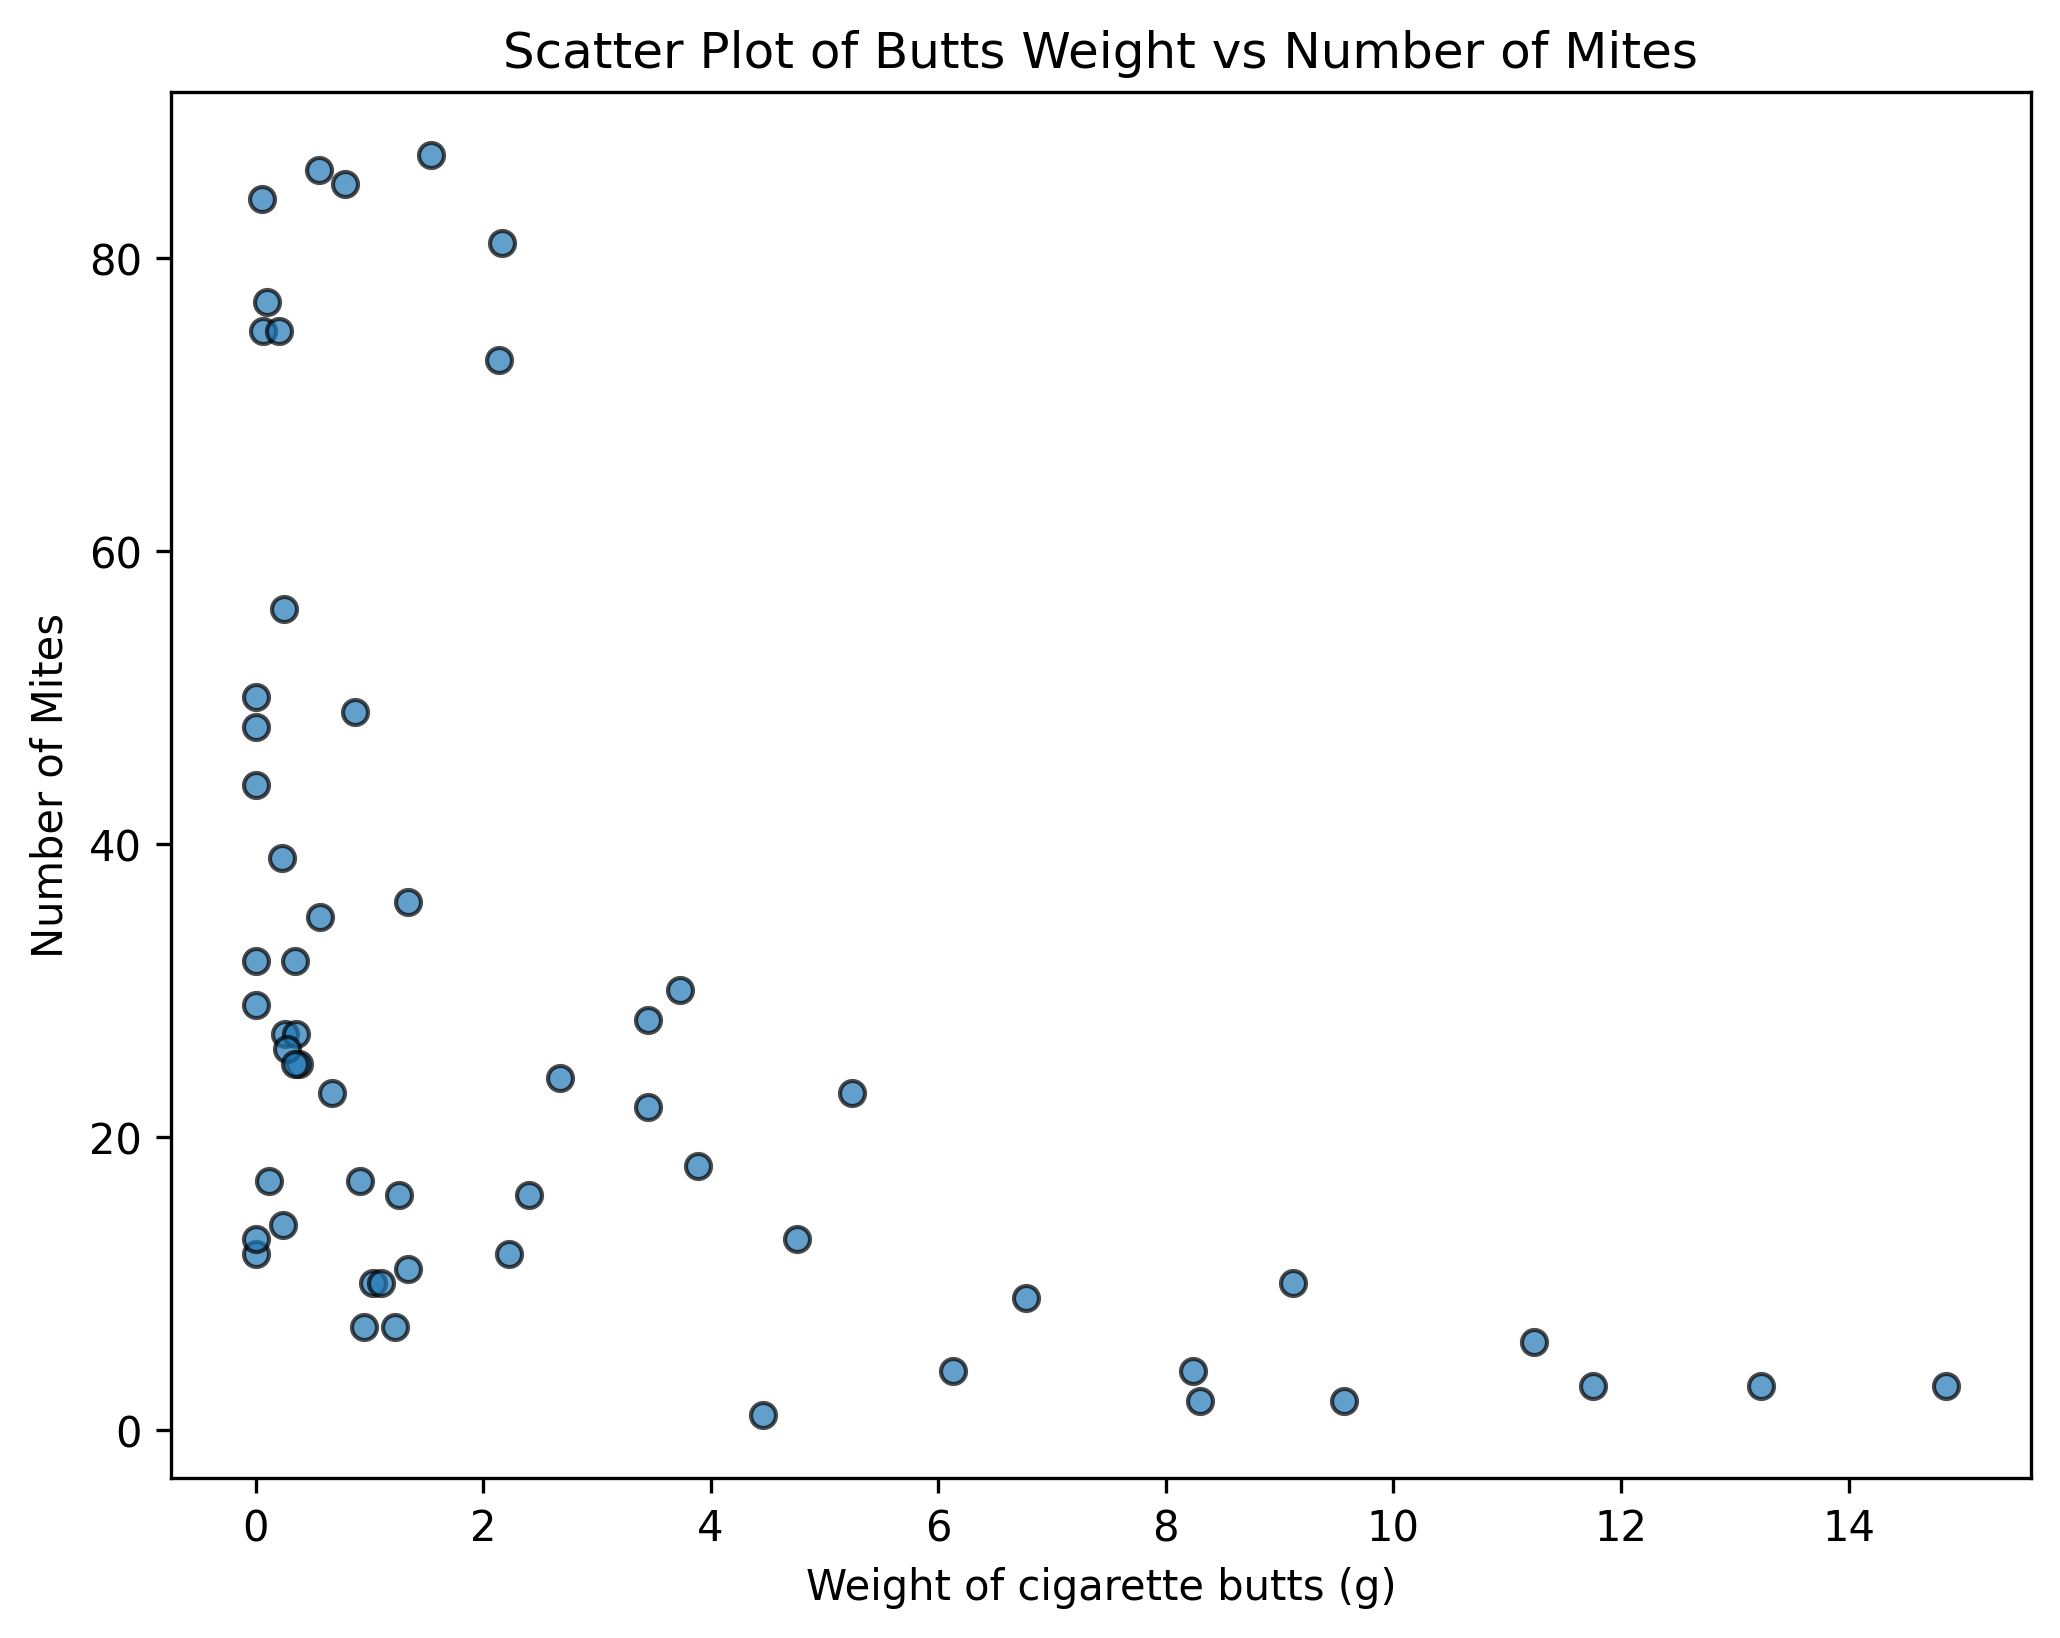
What type of visualization would be best to see the relationship between the weight of cigarette butts and the number of nest parasites?
A scatter plot would be best. This is because the weight of cigarette butts and the number of pests are both quantitative variables, and we want to see the relationship between these two variables.
Weight of cigarette butts#
Below is a histogram of the weight of cigarettes found in different birds nests. Based on the histogram, is the mean or median weight larger? Explain why.
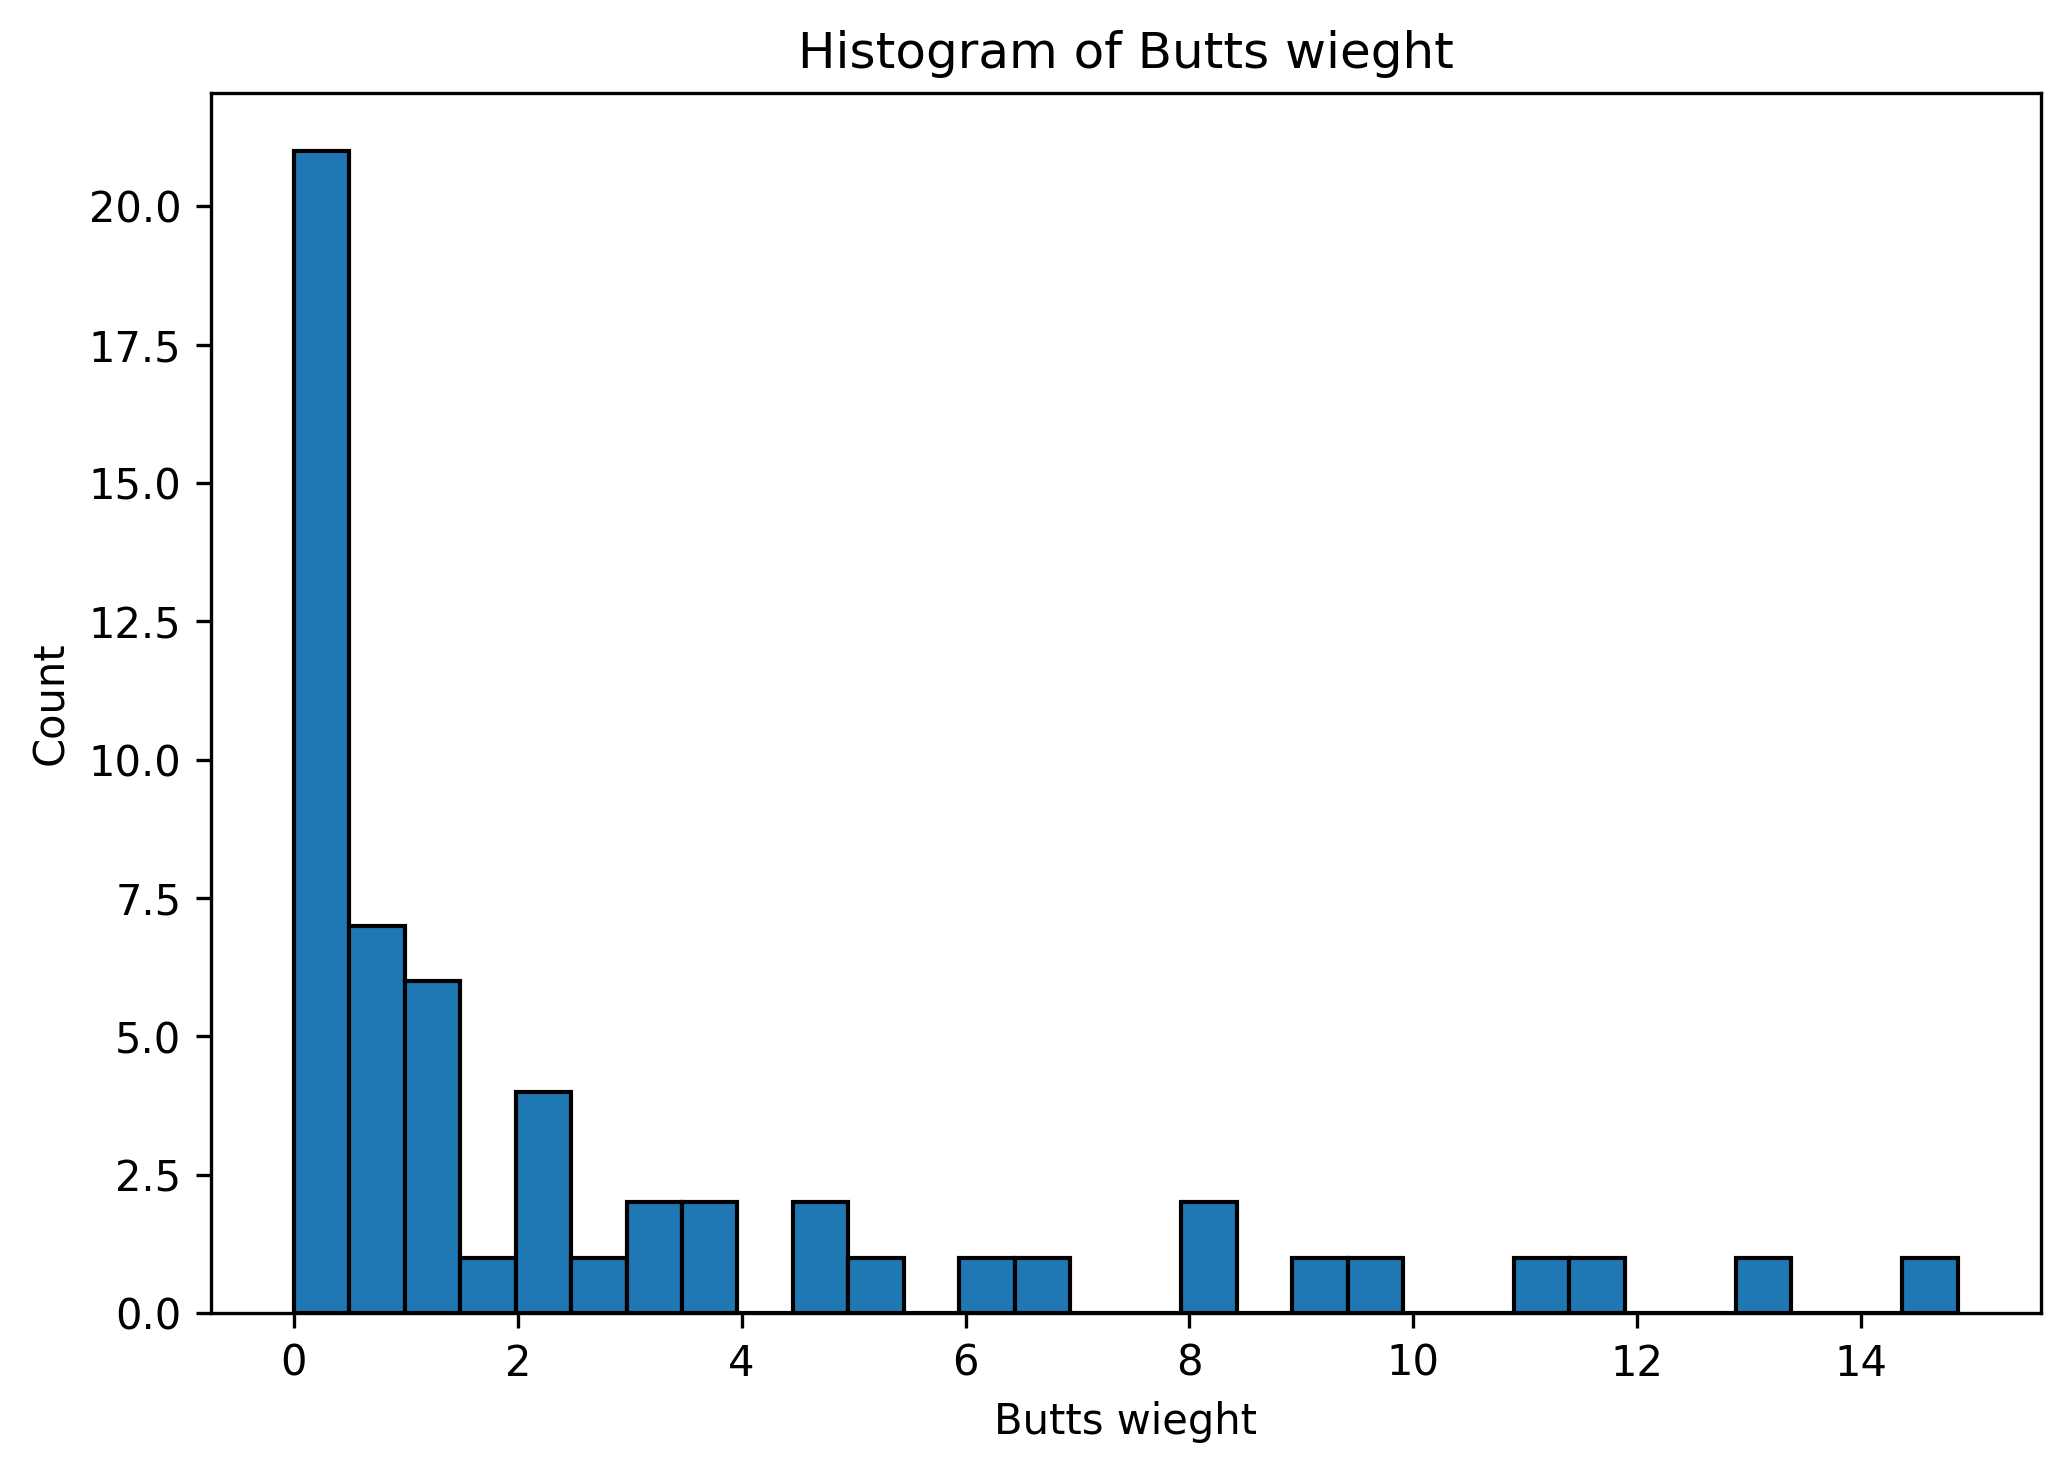
The mean weight is larger than the median weight. This is because the mean is more sensitive to outliers and so the small number of nests with a large weight will increase the mean more than the median.
Vibe-coding#
NYC waste data#
We will vibe-code (ask AI to write code for us) in order to visualize data on waste collection in NYC.
Details are in the Colab Notebook.
You can access the notebook here or under “notebook link” on the course web page for discussion 2.