Worksheet 5: Summaries of center#
Your name:
Your student ID number:
Quantitative variables#
How is a histogram different from a bar chart?
Maps#
What is misleading about the two dot maps of the U.S.A.?
What is misleading about the chloropleth showing the 2016 election results?
Summaries of center#
In the dataset of rower weights:
a) What are the observational units? b) Is weight a quantitative or categorical variable? What visualization could we use to represent the variable weight?
What would happen to the mean, median and mode, if the coxswain weighed only 90 pounds? What if the coxswain weighed 140 pounds?
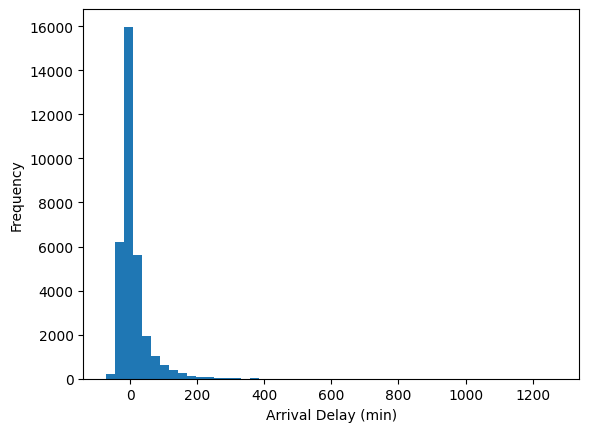
Below is a histogram of the flights data. Do you think the mean or median is larger?