Discussion 3: Summary statistics and vibecoding#
STATS 60 / STATS 160 / PSYCH 10
Today’s section
Recap of lecture material.
Week 3 practice quiz 1.
Exploratory data analysis and summary statistics with vibecoding.
Recap#
Variability#
The variability of a dataset is the extent to which data is spread out and samples differ from each other.
We studied the following quantitative measures of variability:
standard deviation (and variance)
quantiles (percentiles, deciles, quartiles)
The standard deviation measures the average distance to the mean.
75% of datapoints are within 2 standard deviations of the mean.
the standard deviation is sensitive to outliers.
A \(1/k\) fraction of datapoints fall between two consecutive \(k\)-quantiles.
For example,
\(1\%\) of the data falls between the \(41\)st and \(42\)nd percentile.
\(10\%\) of the data falls between the \(3\)rd and \(4\)th decile.
\(80\%\) of the data falls between the \(10\)th and \(90\)th percentile.
Quantiles give us a sense of the shape of the distribution, whereas the standard deviation only gives us a sense of how far datapoints are from the mean.
Quantiles are more robust to outliers than the standard deviation.
When means mislead#
Summary statistics give a snapshot of a dataset. Very different datasets can have the same summary statistics.
Features of a dataset that can cause the mean to be non-representative:
Multi-modal data
Skewed and heavy-tailed distributions
Outliers
High variability
In multi-modal data, the dataset is a mixture of several different groups.
The center of the whole dataset is not necessarily representative of the center of any group.
In skewed distributions, there are very large (or very small) samples that influence the mean.
Right-skewed data: most of the data is small, but a few very large values influence the mean.
“The rich get richer”
Left-skewed data: most of the data is large, but a few very small values influence the mean.
Exam scores, age of mortality
In skewed distribution, the median is often more representative.
Outliers can influence summary statistics like the mean and standard deviation. Usually the median and quantiles are more robust to outliers.
If the variability of a dataset is high, then the mean or median is no longer representative of a “typical” sample.
Week 3 Practice Quiz 1#
Question 1#
I hand you a dataset which shows the weekly section attendance numbers for each of the 5 discussion sections of STATS 60 last quarter. What would you to in an exploratory analysis of this data? What kind of visualizations would you make, which summary statistics would you compute, and why?
There is no one correct answer, you will be graded on whether your approach is reasonable given this sort of data, and whether your approach is likely to reveal interesting trends.
Solution 1#
Make a line plot with the week on the x-axis and attendance on the y-axis with one line for each section to see how different section attendances change over time.
Make a histogram for each section to see the distribution of how many students attended each section. For summary statistics, compute the mean and median attendance for each section.
Also compute the min, max, and mean of all sections combined to detect anomalous weeks.
Question 2#
In the dataset represented by the top histogram below, is the mean
a. About the same as the median,
b. Larger than the median, or
c. Smaller than the median?
Explain why you think your answer is correct. (Even if your answer is technically incorrect, you’ll get full credit if your reasoning is sound—we don’t expect you to compute the mean and median).
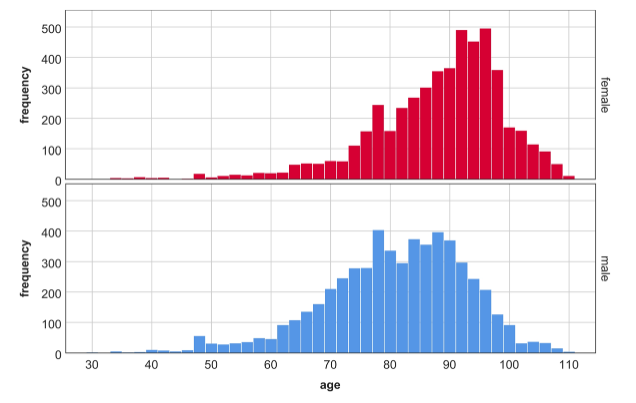
This is a histogram of age of heart failure patients in Lanssnig et al, “A novel hybrid modeling approach for the evaluation of integrated care and economic outcome in heart failure treatment.”
Solution 2#
It looks like the mean is smaller than the median; the distribution looks heavy-tailed on the left, with the highest frequencies on high numbers, and then many entries spread out over low numbers, which usually decreases the mean relative to the median.
Question 3#
Which of the two distributions exhibits greater variability? Justify your answer with an appropriate quantitative measure of variability.
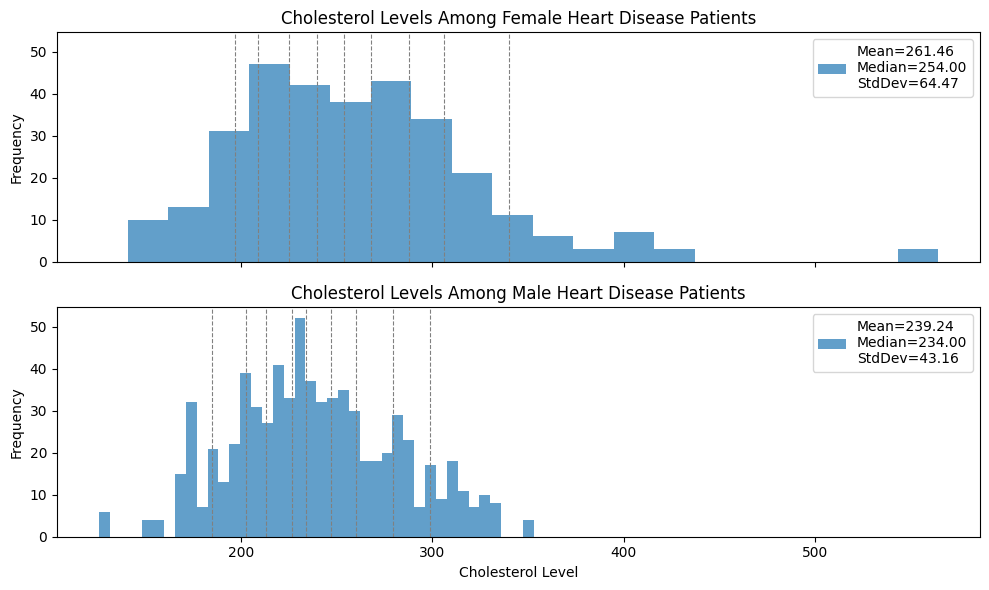
Solution 3#
The Cholesterol level among female patients exhibits higher variability. The means are pretty close and the standard deviation is a factor 2/3 larger, and also the distance between the 90th and 10th percentiles is larger.
Vibe-coding summary statistics#
S&P 500 closing price data#
We will vibe-code (ask AI to write code for us) in order to compute summary statistics of S&P stock prices.
Details are in the Colab Notebook.
You can access the notebook here or under “notebook link” on the course web page for discussion 3.
